The FTSE All-World and FTSE Global All Cap may have similar names, but they are actually 2 different indices.
What is the key difference between the two indices and which one should you be using in your investing strategy?
Here’s what you need to know:
Contents
The difference between FTSE All-World and FTSE Global All Cap
The FTSE All-World index only tracks large and mid-cap stocks, while the FTSE Global All Cap includes small-cap stocks. This results in the FTSE Global All Cap index having a larger number of constituents compared to the All-World index.
Here is a further comparison between these 2 indices.
Country diversification
Both of these indices include the same countries, which are from both developed and emerging markets.
Some of these countries include:
- USA
- China
- Hong Kong
- Japan
- UK
The weightage of each country in each index is rather similar:
| FTSE All-World | FTSE Global All Cap |
|---|---|
| USA (59.46%) | USA (59.54%) |
| Japan (6.25%) | Japan (6.14%) |
| United Kingdom (4.02%) | United Kingdom (4.02%) |
| China (3.63%) | China (3.47%) |
| France (2.78%) | France (2.60%) |
Type of stocks
Here are the types and number of stocks that are found in both indices:
| FTSE All-World | FTSE Global All Cap | |
|---|---|---|
| Type of Stock | Large and mid-cap | Large, mid and small-cap |
| Number of Stocks | 4,089 | 9,343 |
The addition of small-cap stocks to the FTSE Global All Cap index has led to the index tracking many more stocks.
This can be seen by the weightage and number of constituents for USA:
| FTSE All-World | FTSE Global All Cap | |
|---|---|---|
| % of entire index (USA) | 59.46% | 59.54% |
| Number of stocks (USA) | 615 | 1,821 |
There are almost 3 times as many US stocks in the FTSE Global All Cap compared to the All-World index, which are mainly due to the small-cap stocks.
A large cap company is one that has a market capitalisation of more than $10 billion.
Meanwhile, a mid cap company has a market capitalisation of between $2 to $10 billion.
Investopedia
Meanwhile, low-cap companies have a value of ≤ $2 billion.
Top sectors
Here is a breakdown of the top 5 sectors for each index:
| FTSE All-World | FTSE Global All Cap |
|---|---|
| Technology 23.69% | Technology 22.6% |
| Industrial Goods And Services 11.52% | Consumer Discretionary 14.61% |
| Healthcare 10.9% | Financials 14.6% |
| Banks 7.32% | Industrials 13.44% |
| Retailers 5.28% | Healthcare 10.8% |
It is interesting to see that the top sectors are very different for these 2 indices.
This means that the distribution of stocks within both indices are quite different.
Top holdings
Here are the top 5 holdings of both indices:
| FTSE All-World | FTSE Global All Cap |
|---|---|
| Apple Inc. (USA) 4.01% | Apple Inc. (USA) 3.60% |
| Microsoft Corp. (USA) 3.48% | Microsoft Corp. (USA) 3.13% |
| Amazon.com (USA) 1.93% | Amazon.com (USA) 1.73% |
| Alphabet Class A (USA) 1.21% | Alphabet Class A (USA) 1.09% |
| Alphabet Class C (USA) 1.13% | Alphabet Class C (USA) 1.02% |
While the top 5 sectors are quite different in both indices, they have the same top holdings.
Performance
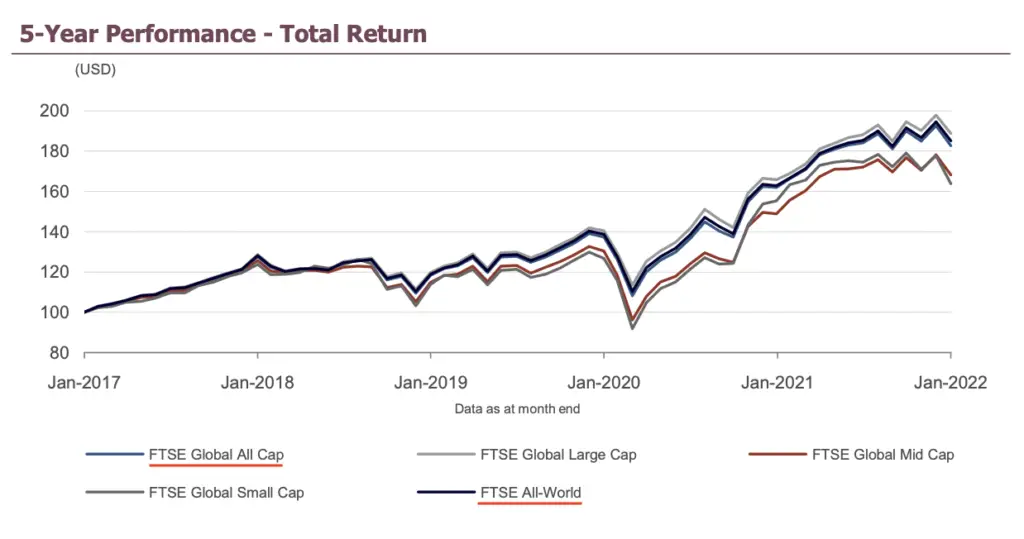
If you compare the performance of both the FTSE All-World and FTSE Global All Cap for the past 5 years, they are actually pretty correlated.

However, past performance does not indicate future returns, so it will be good to do your own research first, before investing in either index!
Availability of ETFs
Here are some of the ETFs that you can buy to track either index:
| FTSE All-World | FTSE Global All Cap |
|---|---|
| VWRL | V3AB |
| VWRP | V3AM |
All of these ETFs are UCITS ETFs that are listed on the London Stock Exchange (LSE).
Compared to other ETFs which track the S&P 500 and FTSE 100, there are only a limited number of ETFs that track each index.
Moreover, VWRP and VWRL are different as they are an accumulating and distributing ETF respectively.
Verdict
Here is a summary of the comparison between the FTSE All-World and FTSE Global All Cap:
| FTSE All-World | FTSE Global All Cap | |
|---|---|---|
| Type of stock | Large and mid-cap | Large, mid, and small-cap |
| Number of stocks | 4089 | 9343 |
| Top sectors | Technology 23.69% Industrial Goods And Services 11.52% Healthcare 10.9% Banks 7.32% Retailers 5.28% | Technology 22.6% Consumer Discretionary 14.61% Financials 14.6% industrials 13.44% Healthcare 10.8% |
| Top holdings | Similar | Similar |
| Past performances | Similar | Similar |
| Exposure to the global economy | Similar | Similar |
| Availability of ETFs | Limited | Limited |
Since these indices are so similar, which should you invest in?
Choose the FTSE All-World if you prefer investing in only large and mid-cap companies
With the FTSE All-World only containing large and mid-cap stocks, the returns that you get are relatively stable.
This is because most of these companies are already well established.
Choose the FTSE Global All Cap if you prefer a more diversified portfolio
The FTSE Global All Cap tracks small-cap stocks, which are not found in the FTSE All-World.
This makes the index much more diversified, as it contains many more companies.
Small-cap stocks may be more risky, but they have greater potential to generate more growth compared to large or mid cap stocks.
As such, it really depends on your risk profile and diversification to decide on which index you wish to track!

Do you like the content on this blog?
To receive the latest updates from my blog and personal finance in general, you can follow me on my Telegram channels (Personal Finance or Crypto) and Facebook.
Are you passionate about personal finance and want to earn some flexible income?


