Last updated on June 6th, 2021
You may have come up with the best investment strategy ever. You decide to backtest your strategy, but don’t have the coding know-how to do so.
Furthermore, manual backtesting can be really tedious!
With PyInvesting’s backtest platform, you no longer have to worry about this problem anymore.
Here’s a deep dive into this platform, and how it can be beneficial for you.
Contents
What is PyInvesting?
PyInvesting is a platform that allows you to backtest your strategy without any coding. You are able to set your strategy based on your desired parameters.
PyInvesting will then backtest your strategy against a benchmark.
If your strategy consistently performs better than the benchmark, this may give you greater confidence that your strategy works.
However, it is important to remember that past returns cannot predict future returns! Even though your strategy worked in the past, there is no guarantee that it’ll work in the future.

Once you’re confident that your strategy works, you are able to go live with it. PyInvesting will decide on the best stocks that fit your strategy and suggest you to buy them.
If you are a premium member, PyInvesting allows you to create a ‘robo-advisor‘. Instead of having to rely on the robo-advisor’s algorithm, it will be based on your strategy.
What are PyInvesting’s features?
PyInvesting has lots of features, and here’s a breakdown of some of them:
#1 Stock Profile
PyInvesting has an extensive list of instruments that you can view information on.
This includes:
- SGX
- US stock exchanges
- SHG (Shanghai)
- SZSE (Shenzhen)
- HKEX (Hong Kong)
- TSE (Japan)
- LSE (London)
- WAR (Poland)
- KSE (Kuala Lumpur)
- TSX (Toronto)
- KRX (Korea)
- Forex
- Crypto
You are able to search for any stock using the search bar function.
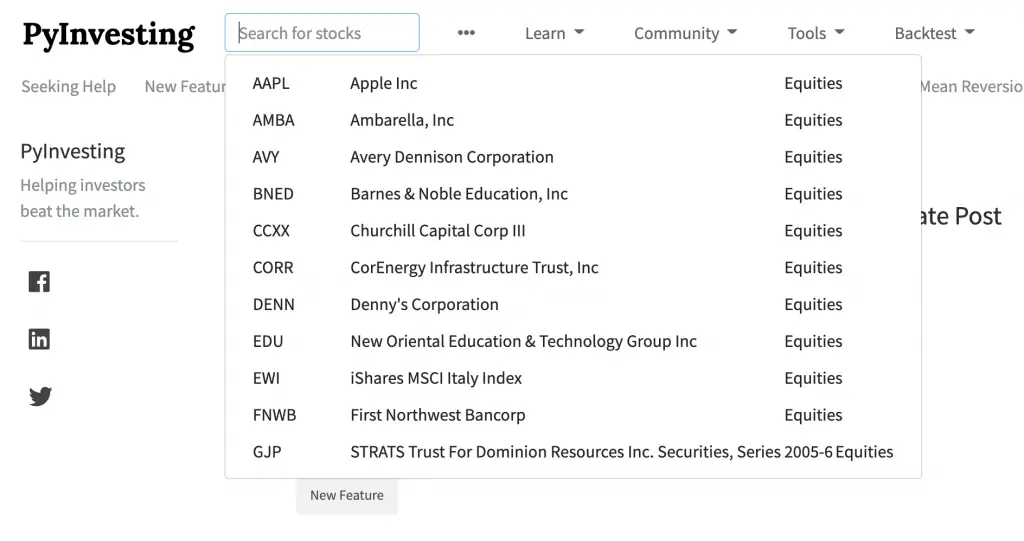
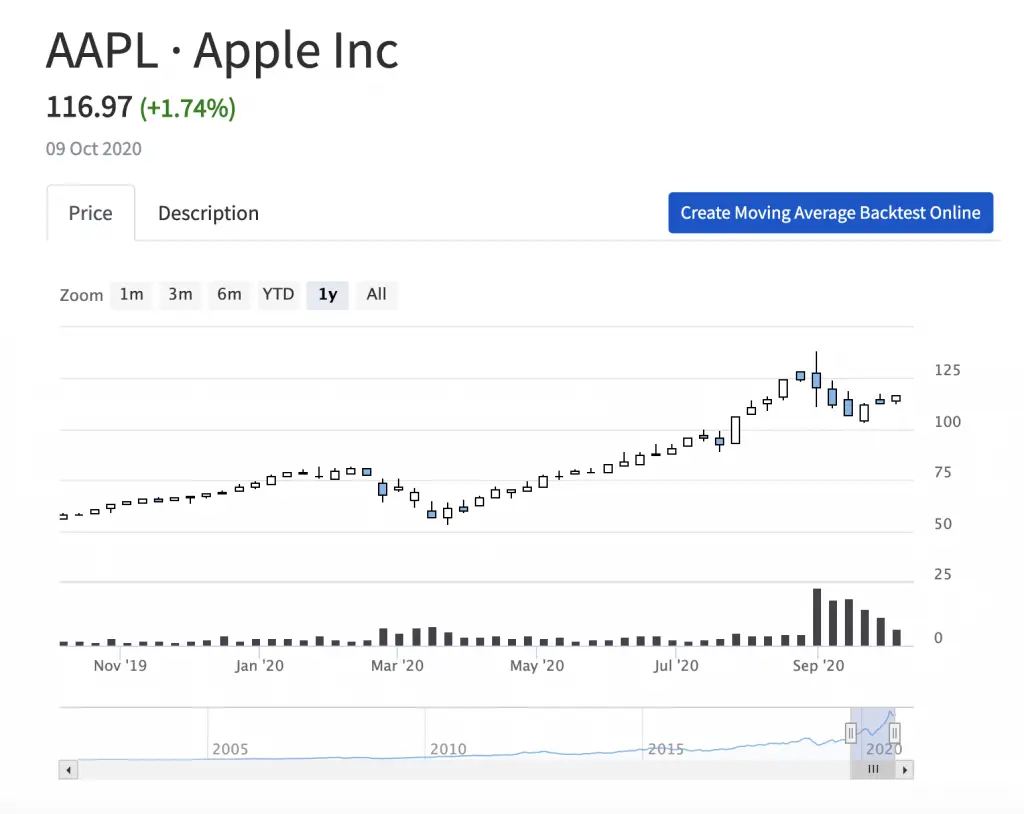
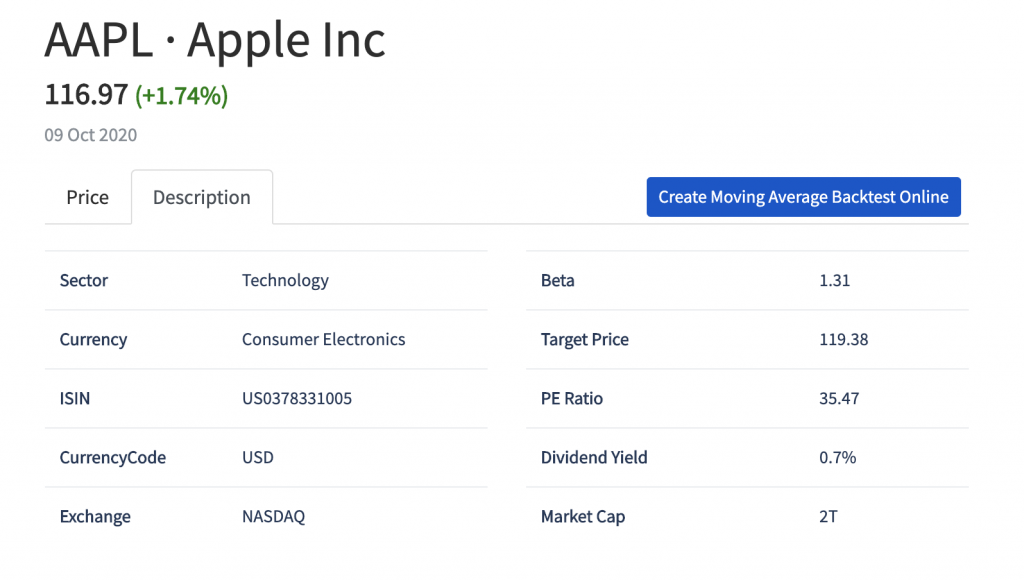
Here are some features that you can view on each stock’s profile:
1. Price changes
2. Stock metrics
3. A simple scoring system for the stock
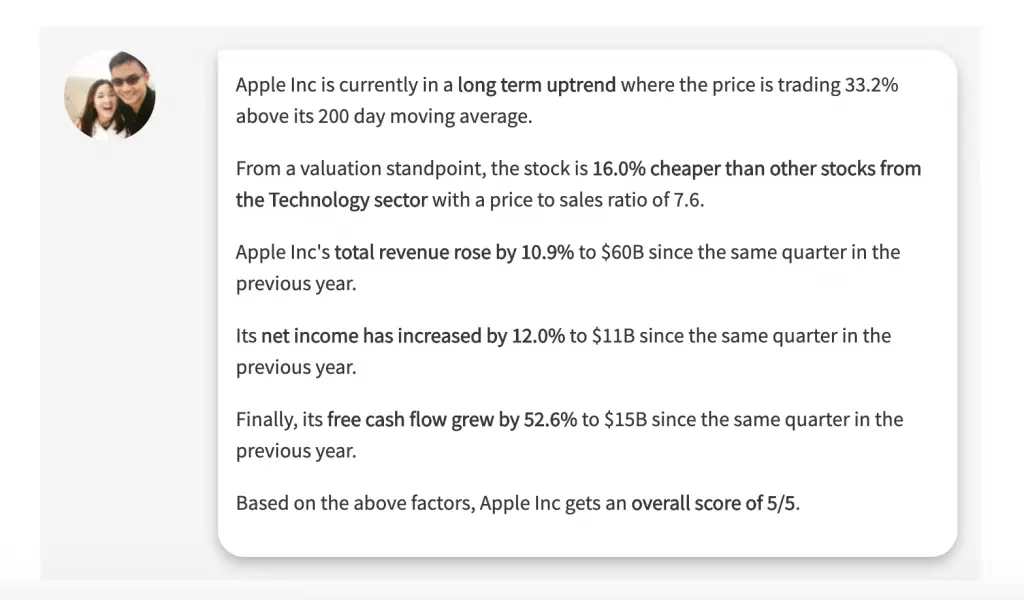
This score is updated daily, based on the stock’s fundamentals.
This gives you a good gauge on how the stock is performing.
4. Earnings
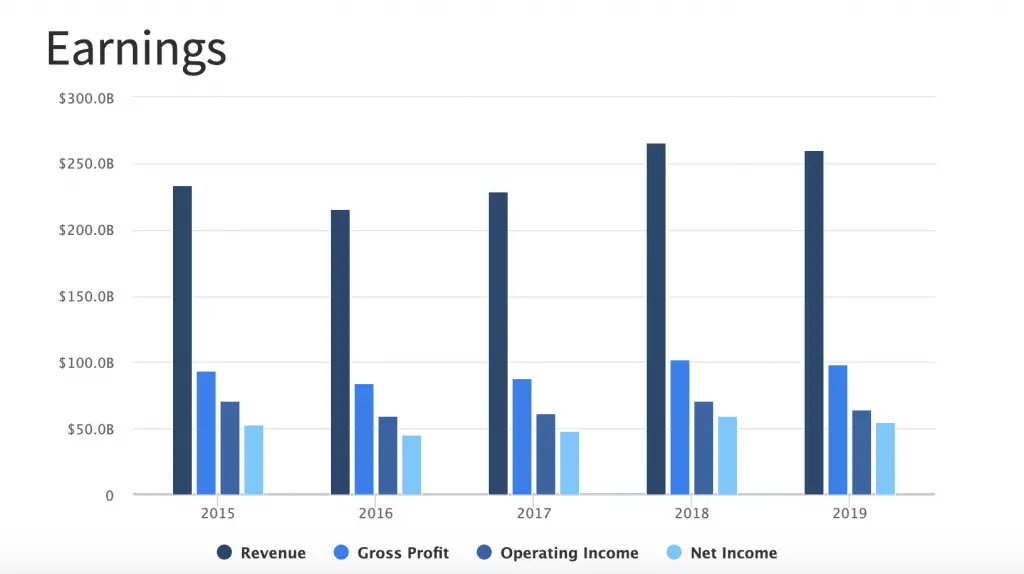
You will be able to compare the stock’s
- Revenue
- Gross profit
- Operating income
- Net income
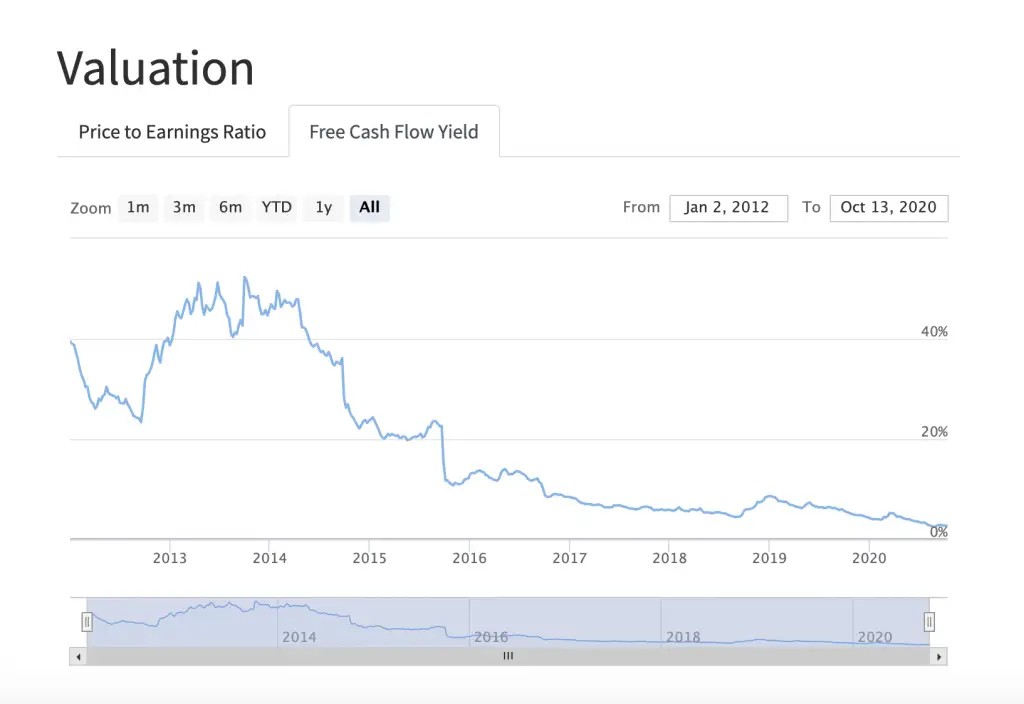
5. Valuation
You can see the stock’s price to earning ratio,
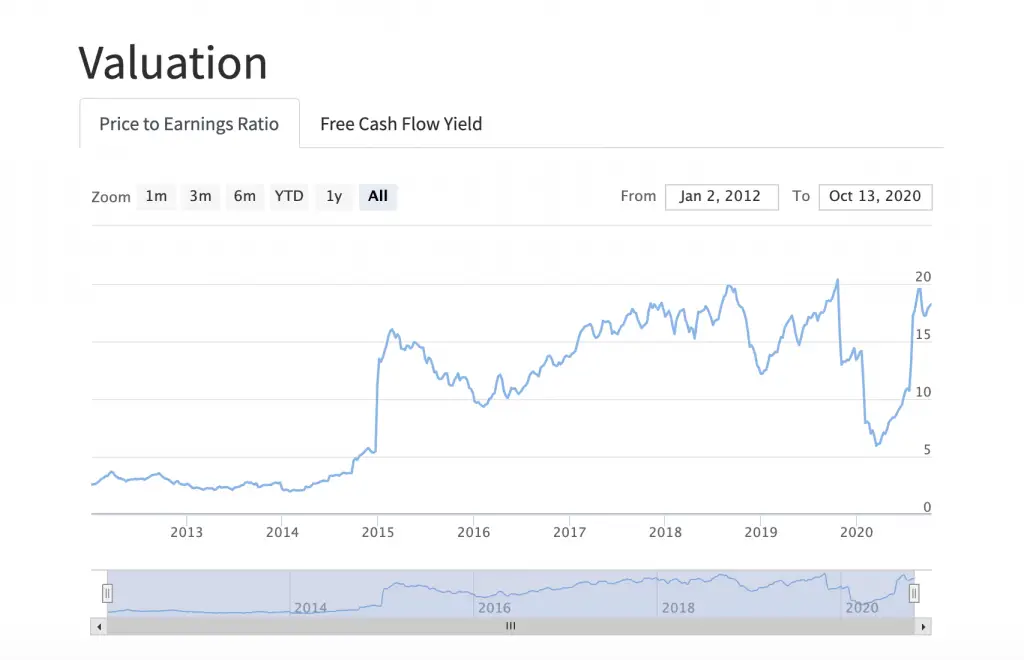
and the free cash flow yield.
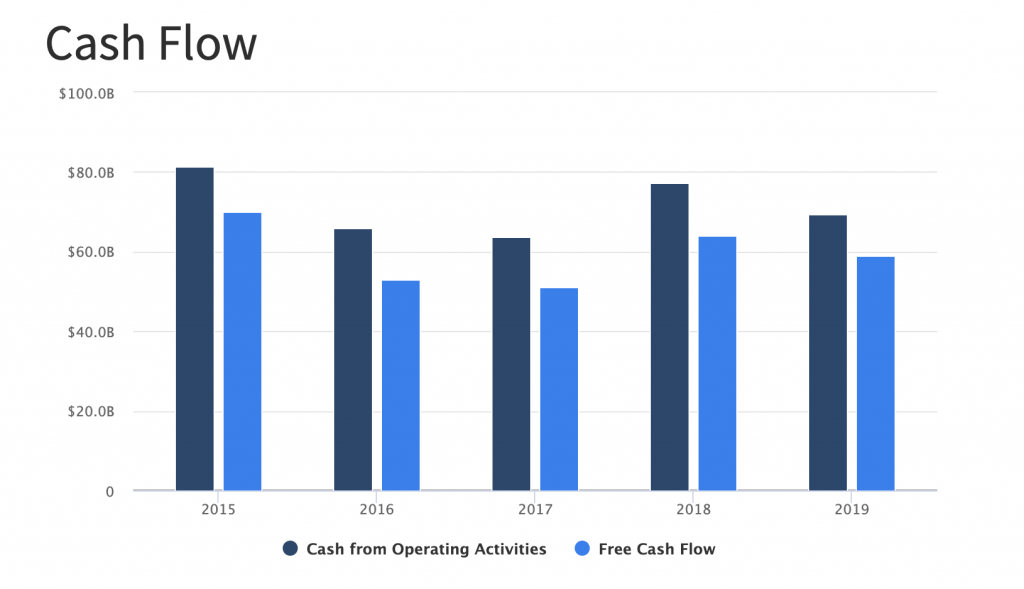
6. Cash flow
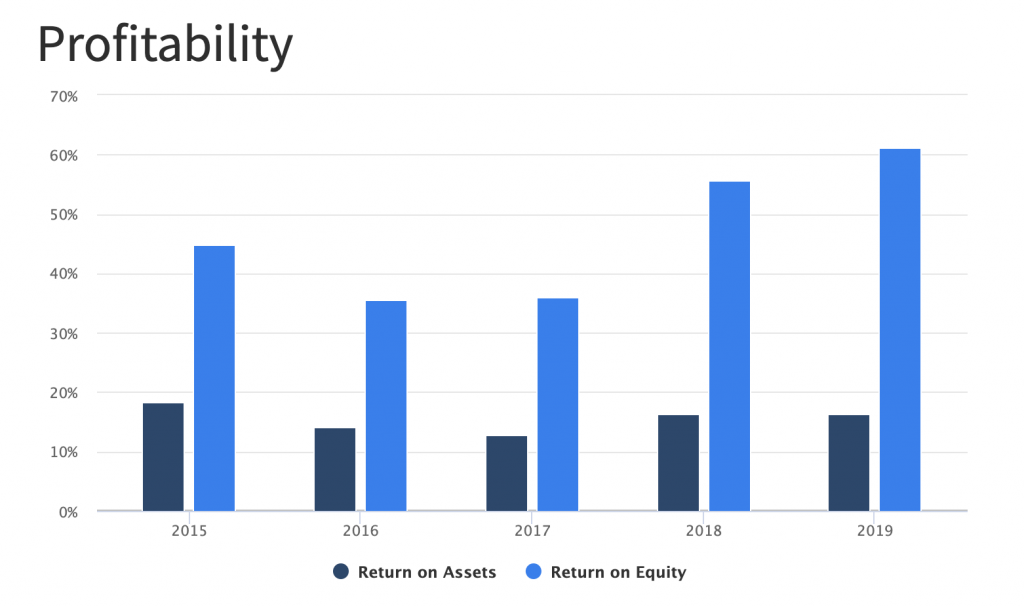
7. Profitability
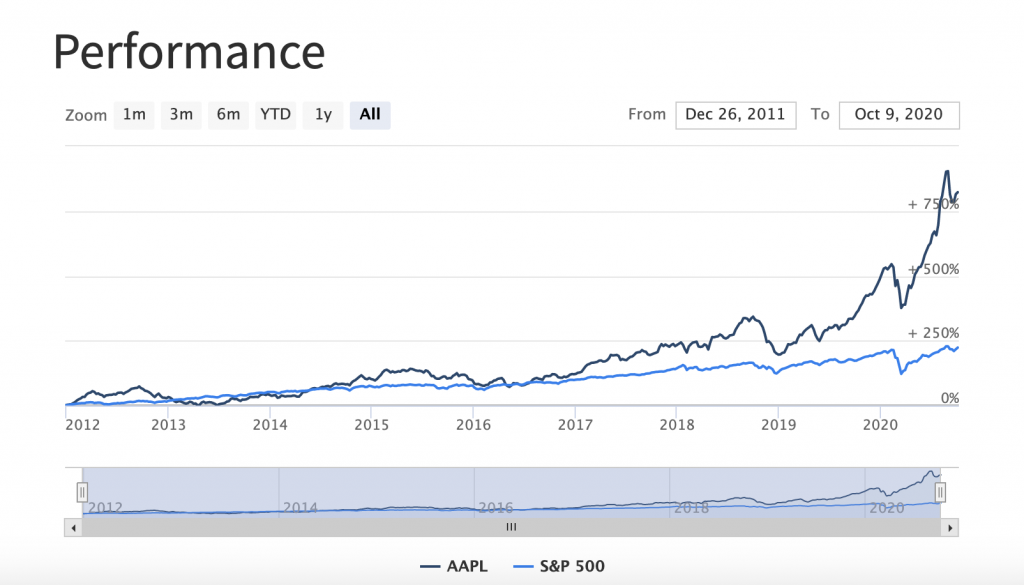
8. Performance
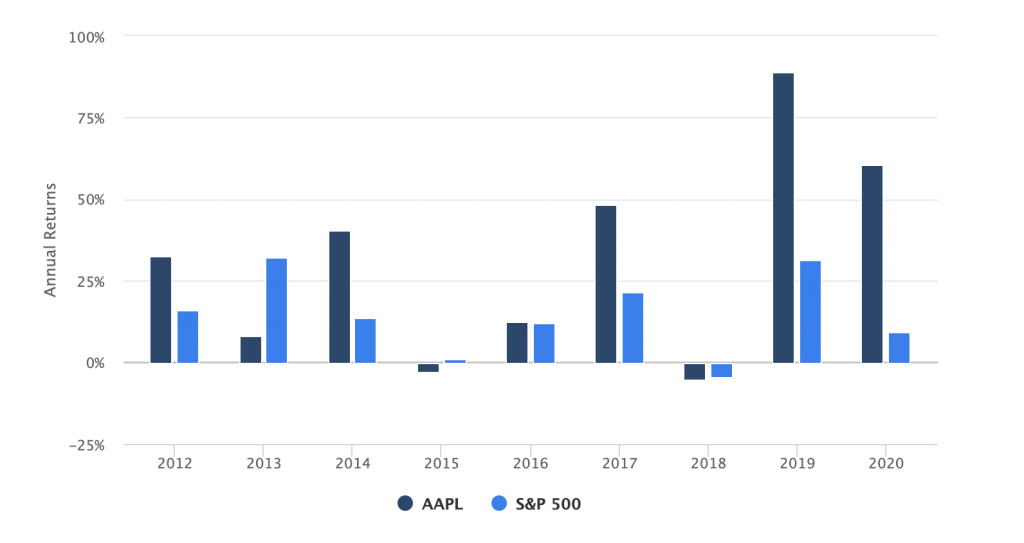
You can see the performance of the stock against the benchmark (S&P500),
and the annual returns as well.
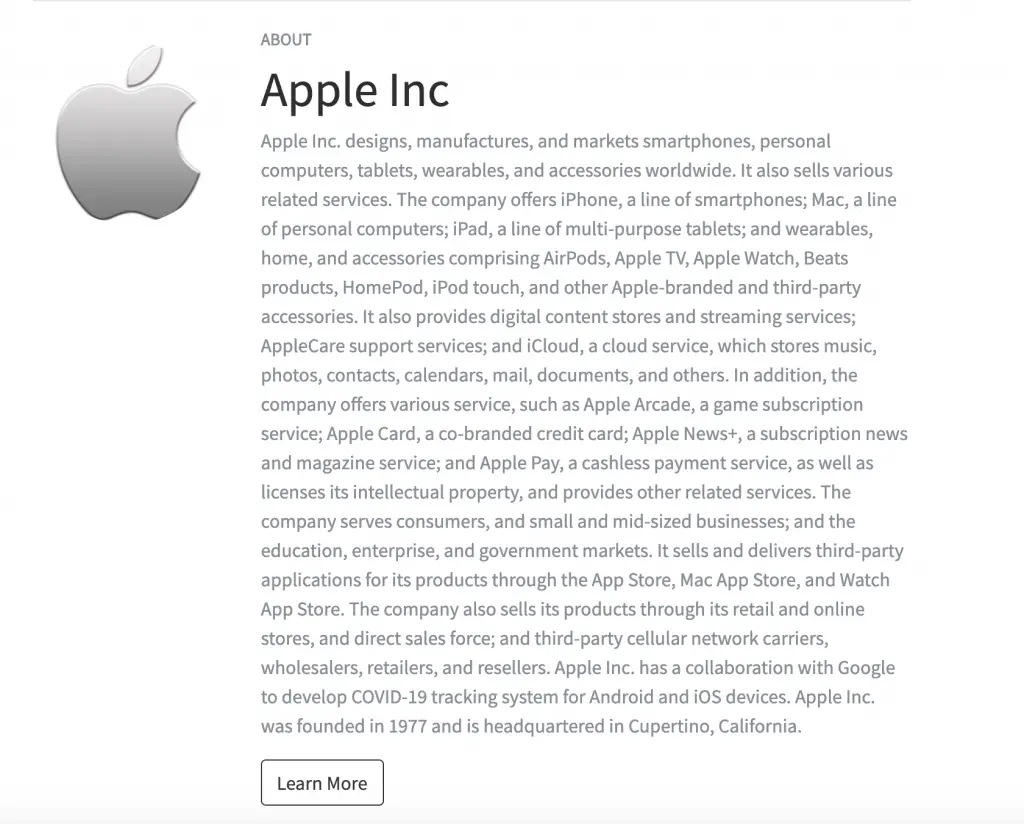
9. Information about the stock
Lastly, you can view some information regarding the stock.
#2 Screener
PyInvesting has a simple stock screener with some parameters to choose from.
Here’s how you can use the screener.
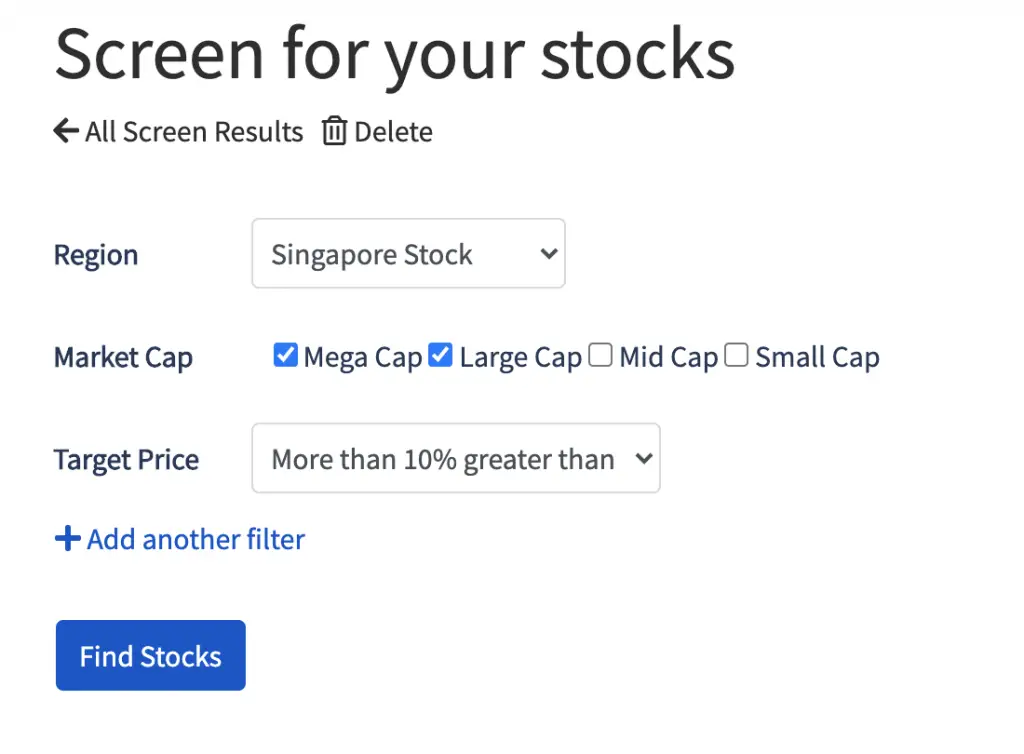
1. Select which exchange you would like to screen
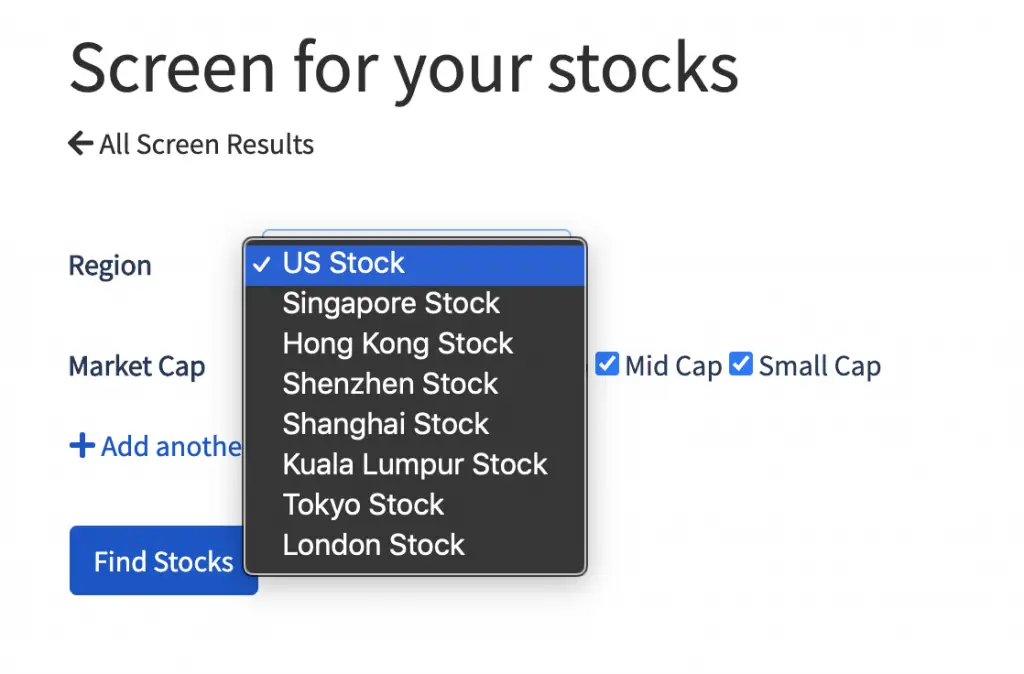
You are only able to screen from these 8 different exchanges.
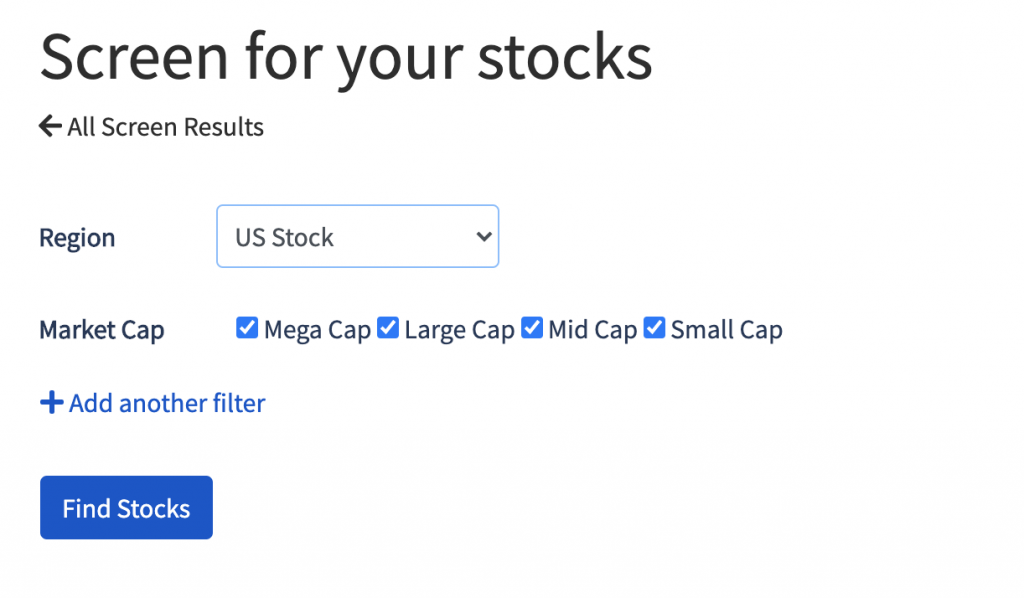
2. Select the market caps that you wish to screen
3. Select additional filters
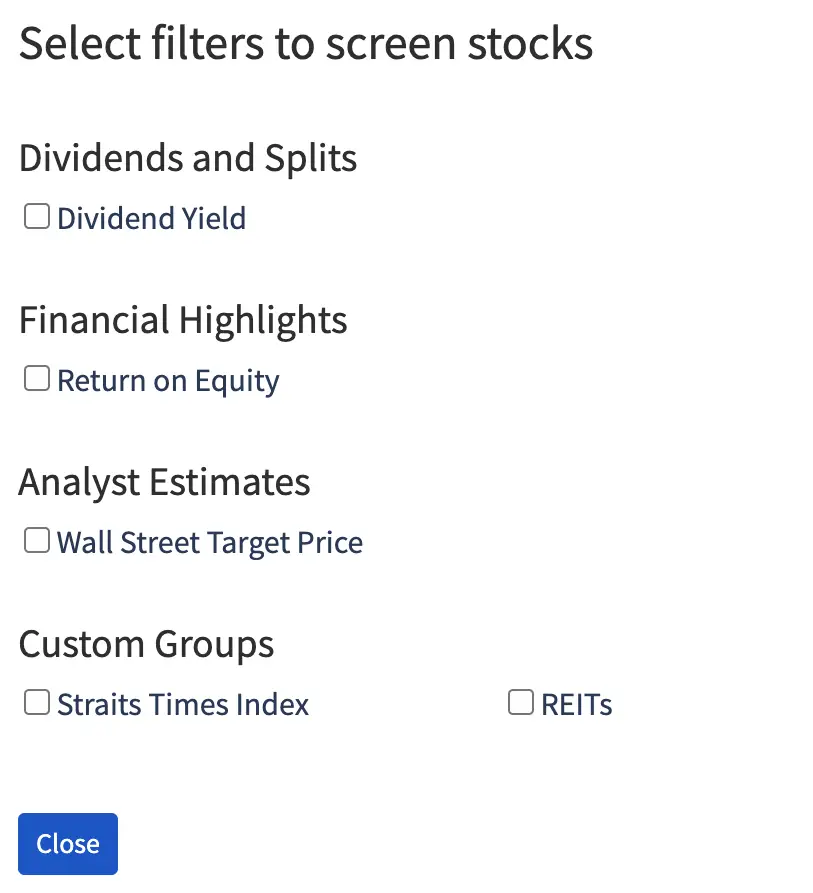
There are additional filters that you can add, though they are pretty basic for now.
If you want to have a more advanced screener, you may consider using StocksCafe instead.
4. Select the parameters for the additional filter you’ve added
5. View the stocks that passed your screen
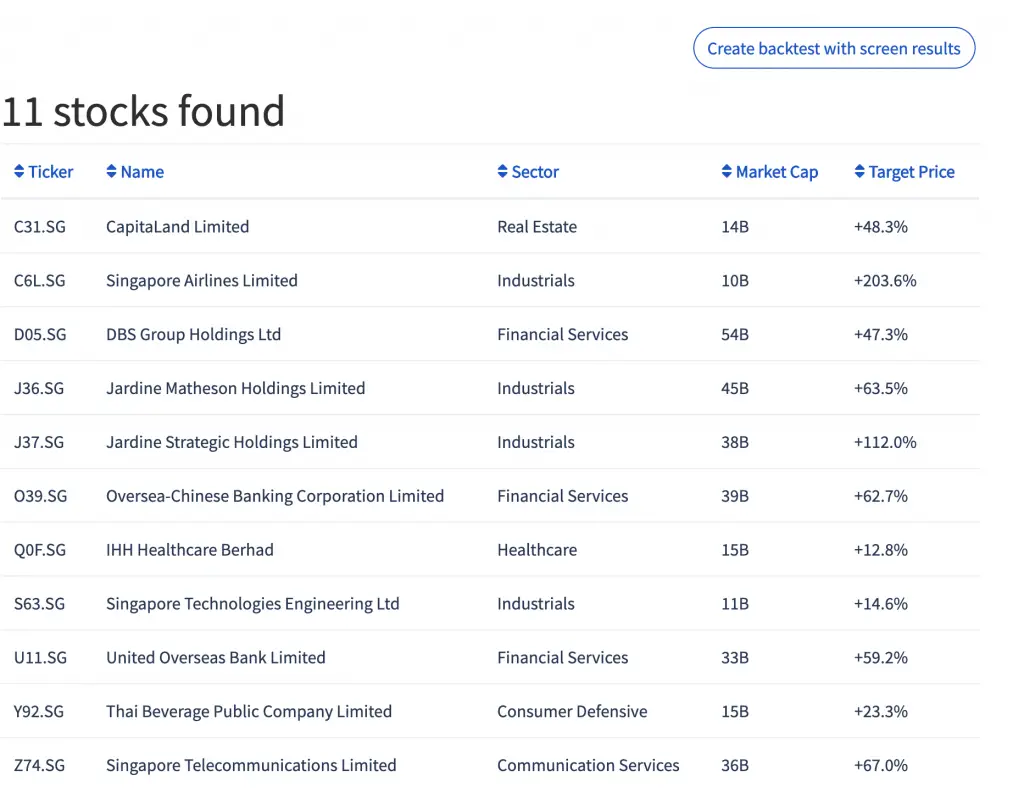
If you’re happy with the screen, you can create a backtest with this screen results.
#3 Fear and Greed Index
The Fear and Greed Index decides your allocation between cash and equities.
This index is determined by how many stocks are in the downtrend.
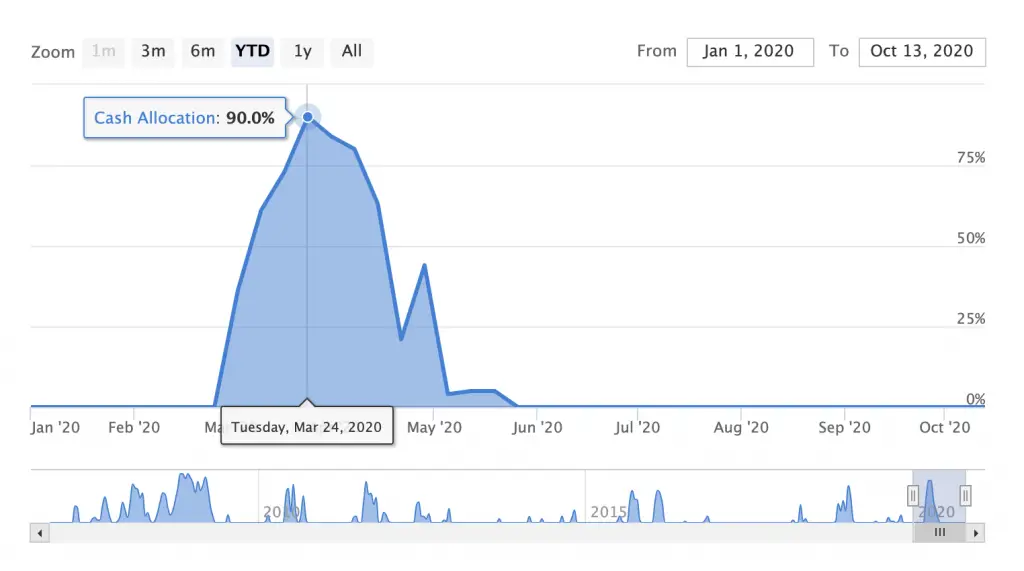
When more stocks in the downtrend, you will be recommended to keep more of your portfolio as cash.
This can be seen during the COVID-19 crisis. In March 2020, PyInvesting recommended you to keep 90% of your portfolio in cash.
However, when most stocks are in an uptrend, the Index will recommend you to allocate your cash into the S&P500 (or equities).
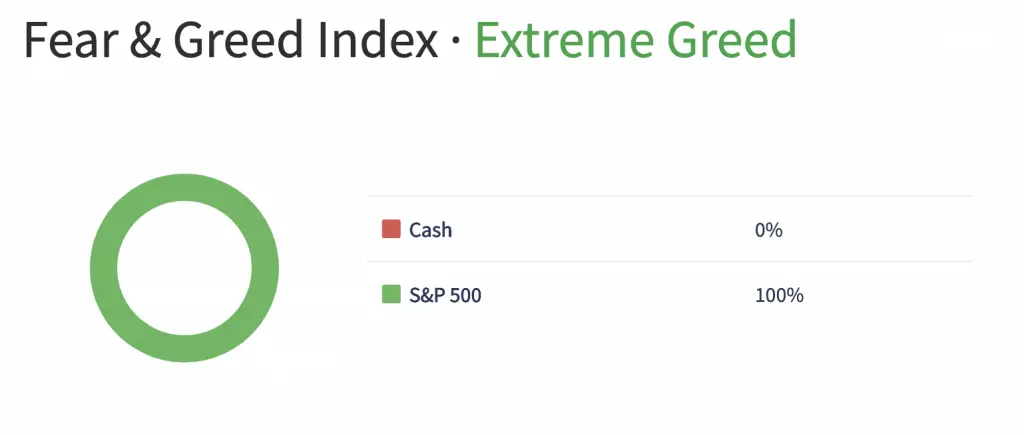
You are able to track how the Fear and Greed Index has performed, compared to leaving your funds entirely in the S&P500.
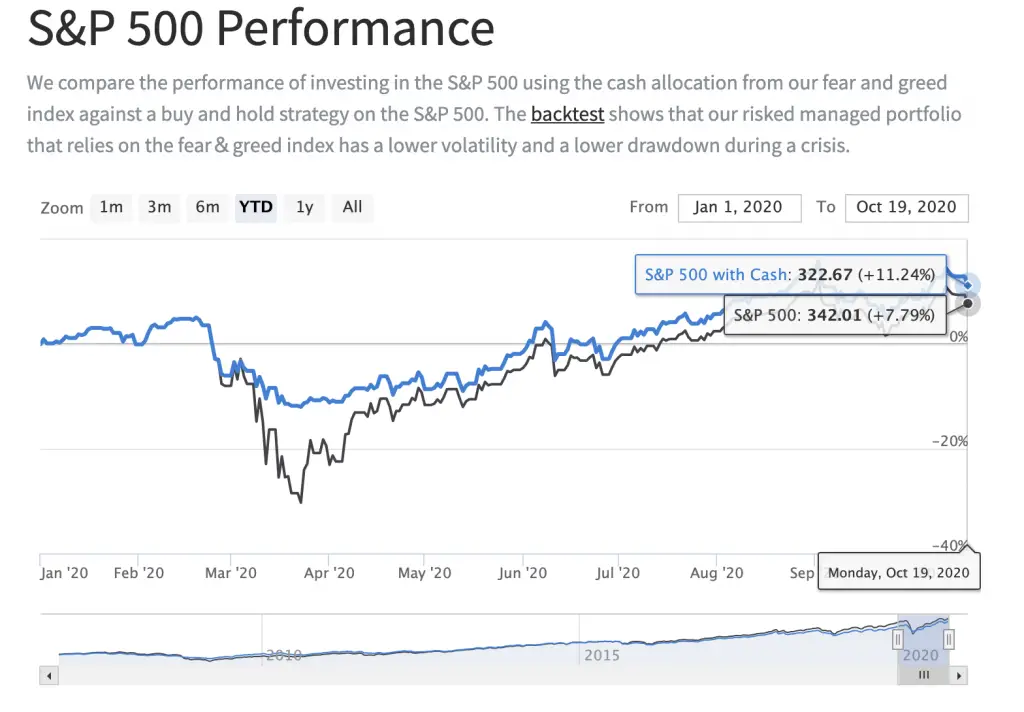
The index recommended you to leave most of your funds in cash during the March 2020 crash.
If you had followed this suggestion, you would have a lower volatility compared to leaving your entire portfolio in the S&P500.
#4 Backtesting
Backtesting is PyInvesting’s main feature.
This allows you to backtest a strategy that you have created.
You will compare this strategy to a benchmark. If you are happy with the backtest, you are able to go live with this strategy.
Here are the 4 main strategies that you can use:
| Strategy | Definition |
|---|---|
| Relative Strength | Highest relative strength and strongest signals |
| Moving Average | Stocks trading above their moving average |
| Strategic Allocation | Rebalancing to target allocations for different asset classes |
| Fundamentals | Top few stocks with strongest fundamentals |
You may not be comfortable to build your own strategy. Instead, you can use a sample quantitative investment strategy found on the platform.
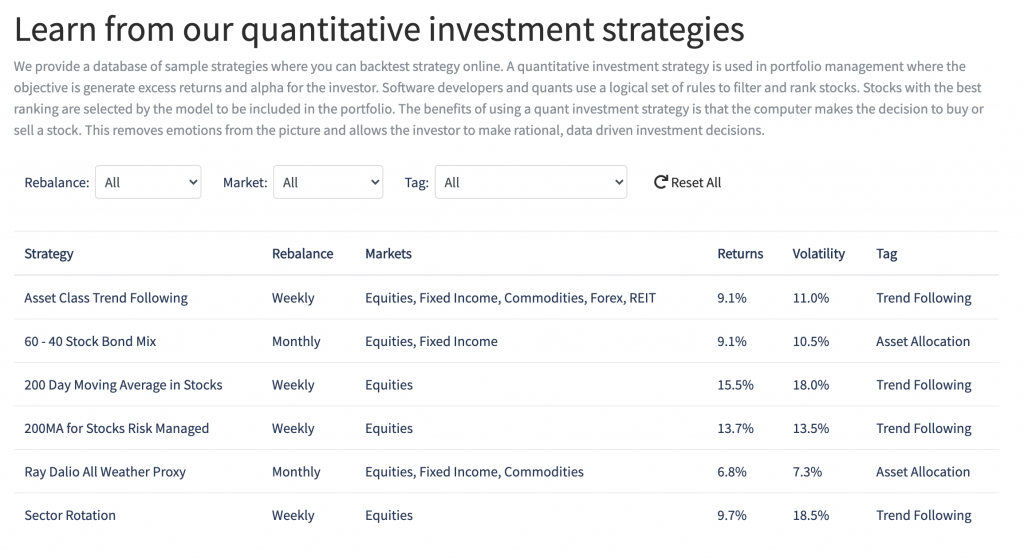
Here’s a step-by-step guide on using PyInvesting’s backtest feature.
1. Select your investing universe
The first thing you’ll need to do is to select your investing universe.
This limits your backtest strategy to be performed only on the stocks that you’ve selected.
There are 3 ways that you can select your universe:
- Manually select your stocks
- Add stocks from a PyInvesting screen
- Add stocks from a StocksCafe screen
If you wish to manually select your stocks, you can choose from the extensive range of instruments on PyInvesting.
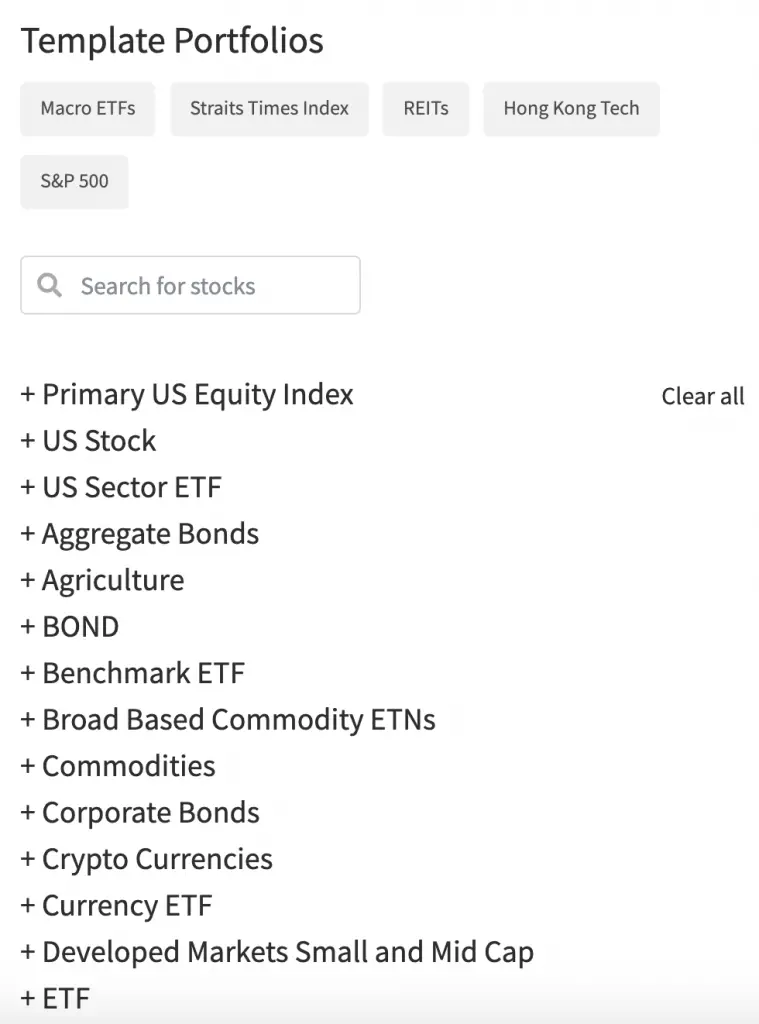
Besides adding them manually, you can add stocks from a screen from either PyInvesting or StocksCafe.
2. Select your Benchmark
This will be a benchmark that you will compare your strategy against.

You may want to use an index as your benchmark. The index that you choose depends on the exchange that you’re purchasing your stocks from.
For example, if you are looking at US stocks, you will want the benchmark to be SPY (S&P 500 ETF).
3. Change the parameters of the backtest strategy
Depending on the strategy that you’ve chosen, you can change certain parameters:
#1 Relative Strength
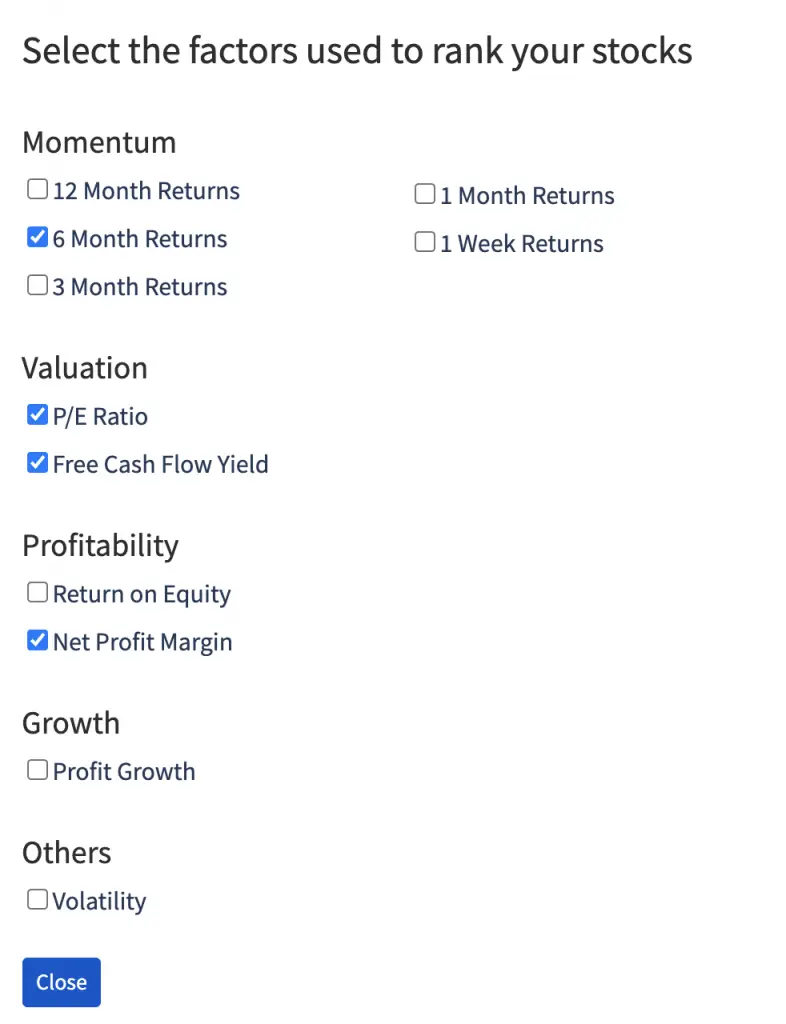
You will need to choose the type of Moving Average you would like to track.

You can the signals you wish to track, as well as the weightage.
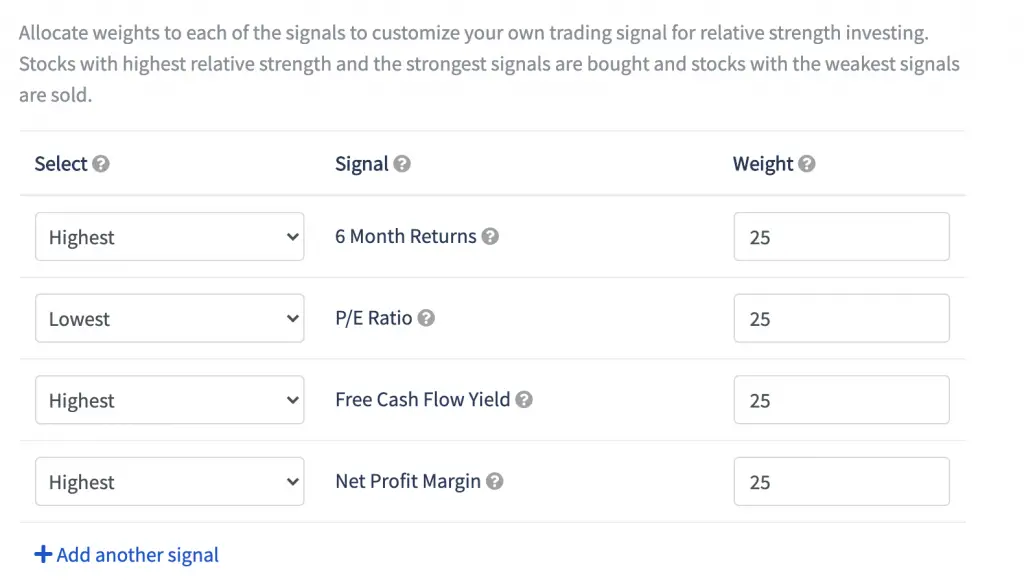
You can add more factors to rank your stocks as well.
#2 Moving Average
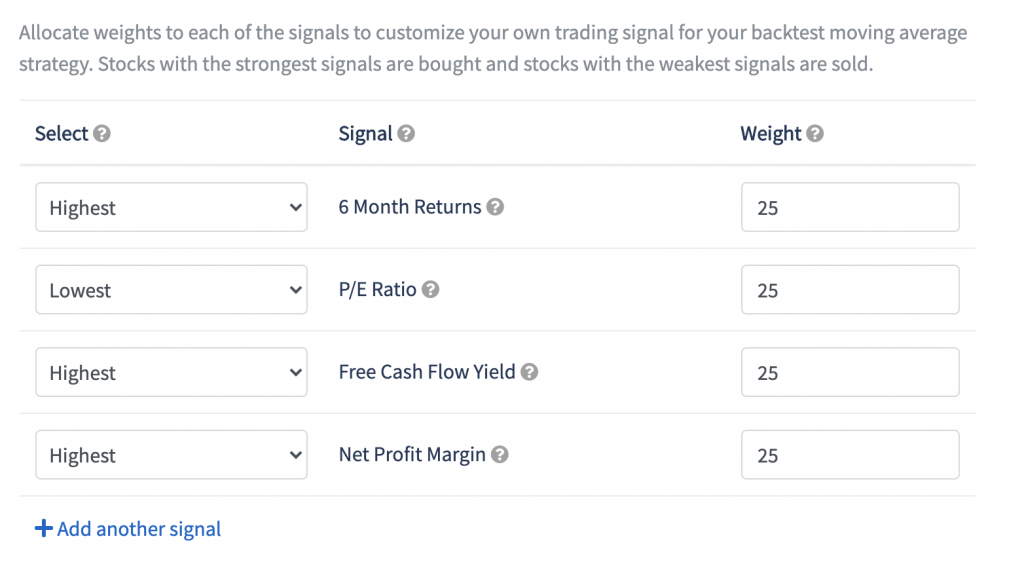
You will need to select the signals you wish to track too, as well as their weightage.
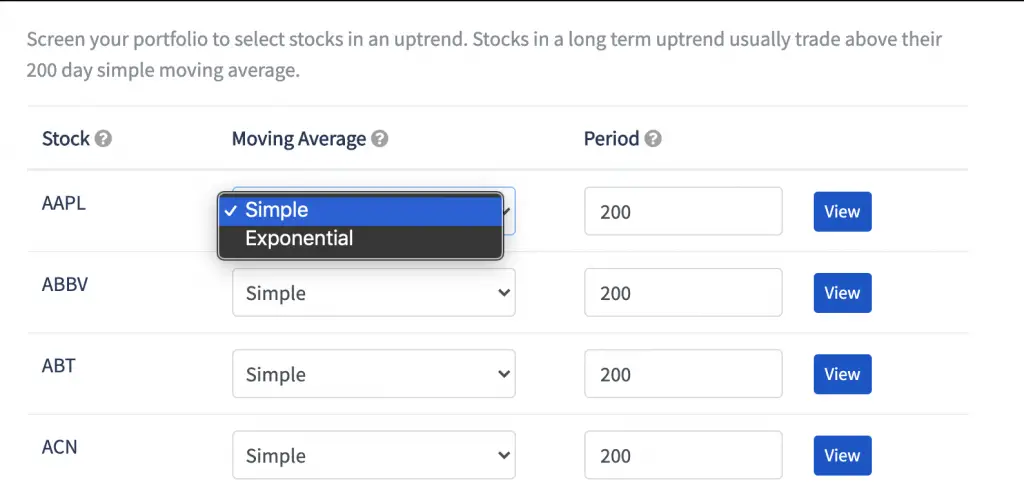
You can then choose the type of moving average you wish to track for each stock. You can choose the period to track the moving average too.
#3 Asset Allocation
You can choose the portfolio weight you wish to have for each stock.
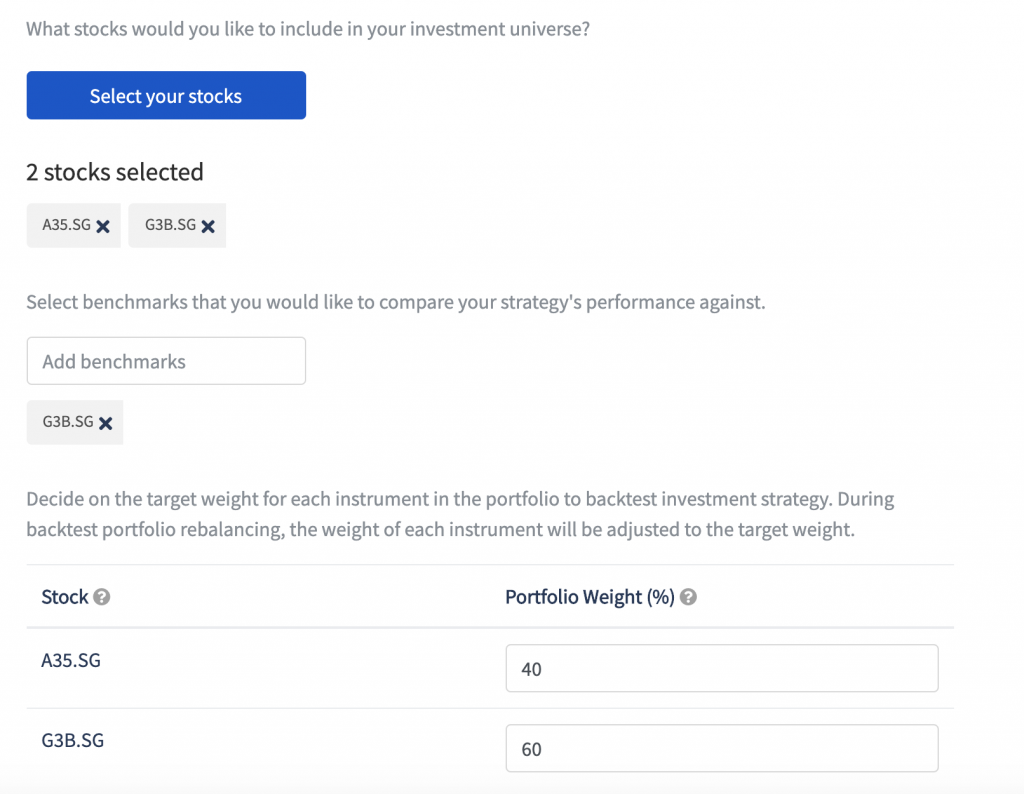
This strategy will help you to buy and sell your stocks to remain in this asset allocation.
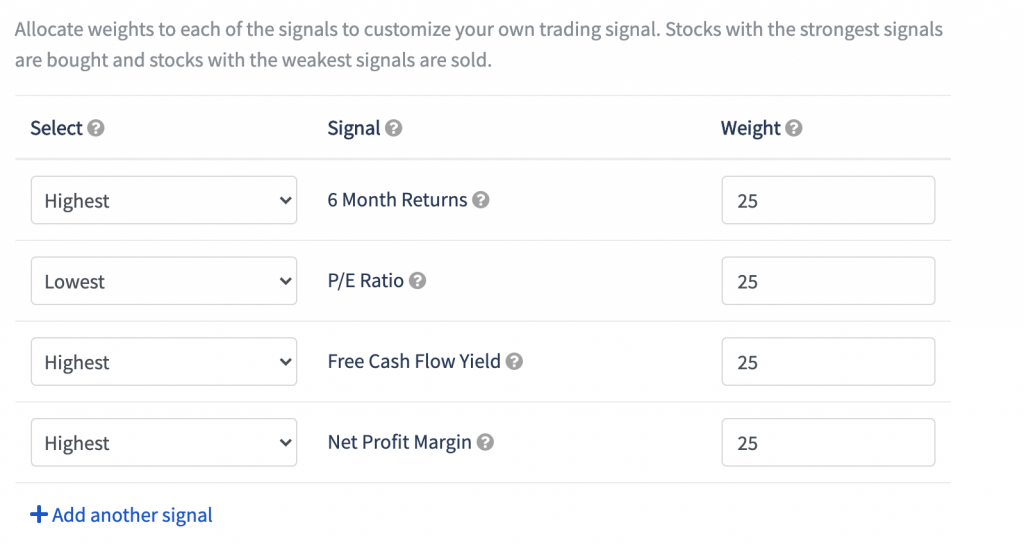
#4 Fundamentals
You will need to select the signals you wish to track, as well as the weightage.
4. Select how many stocks in your portfolio
This step requires you to:
- Select the number of stocks in your portfolio
- Select the portfolio rebalance frequency
- Select the base currency
- Name your strategy
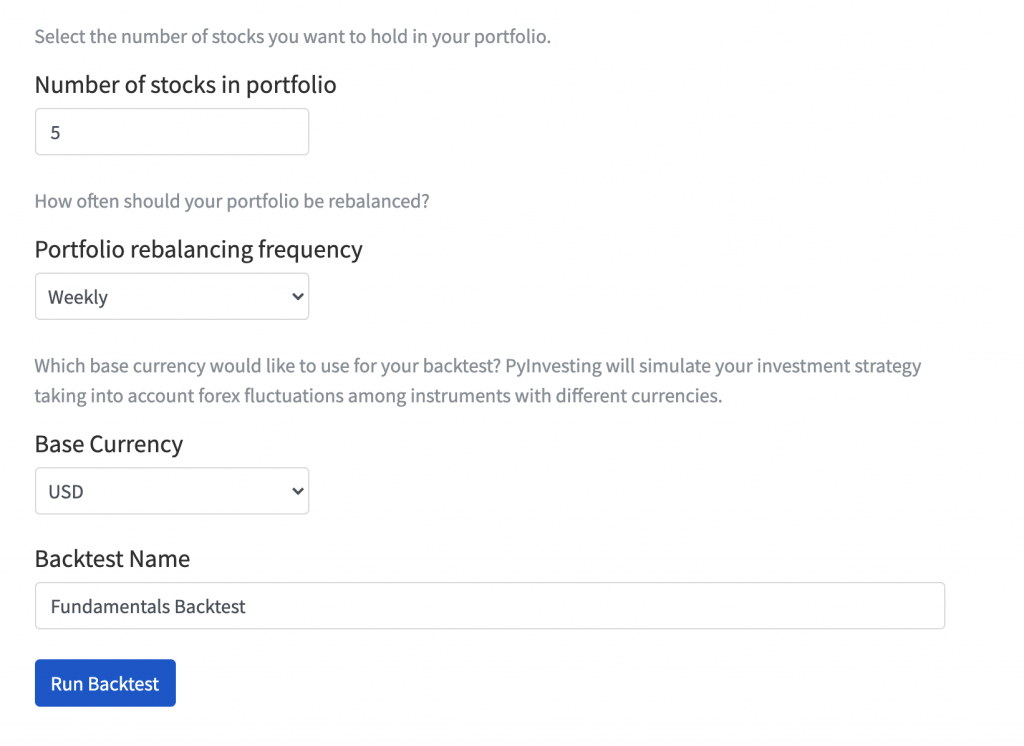
Remember to change the number of stocks! This will determine how many stocks should be included in your portfolio.
If you leave the stocks as 1, you will only have 1 stock in your portfolio other than cash!
When you are running the Fundamentals or Moving Average backtests, you are given the added option of adding a cash allocation.
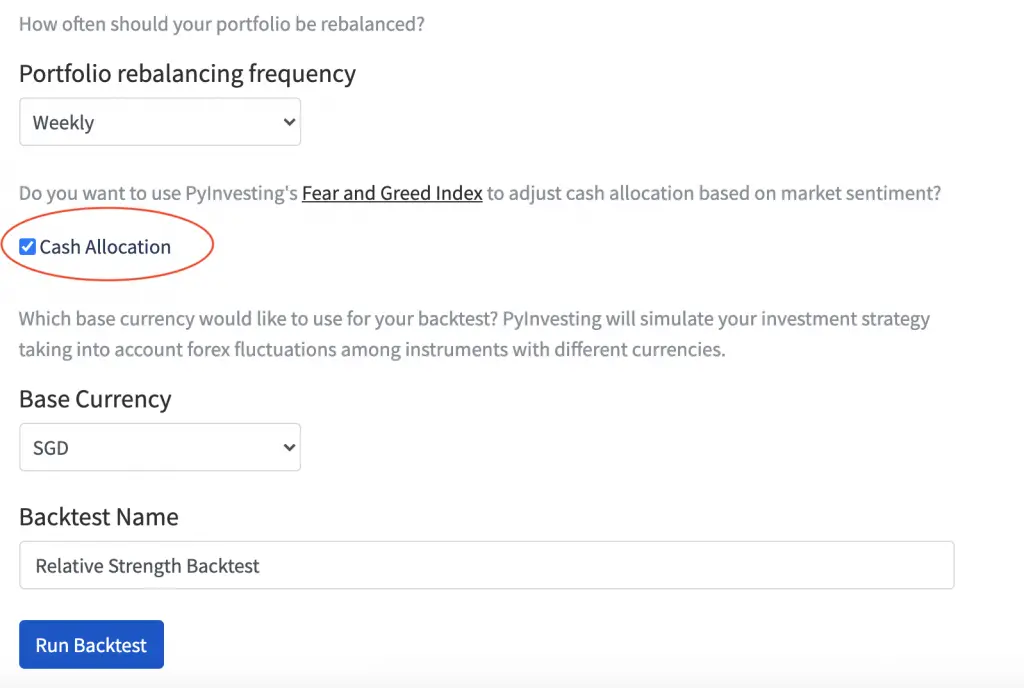
This is based on the Fear and Greed Index that determines the percentage of cash you should have in your portfolio.
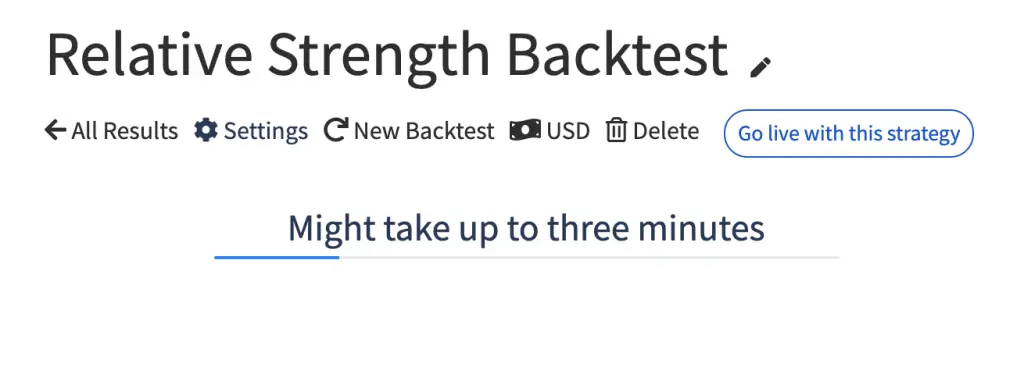
5. Run your backtest strategy
Your backtest will take around 3 minutes to be done.
6. View your results
Once the backtest has finished running, you can view the results.
Here are 6 things that you can view:
#1 Performance against benchmark
Here you are able to compare how your strategy has performed against the benchmark.
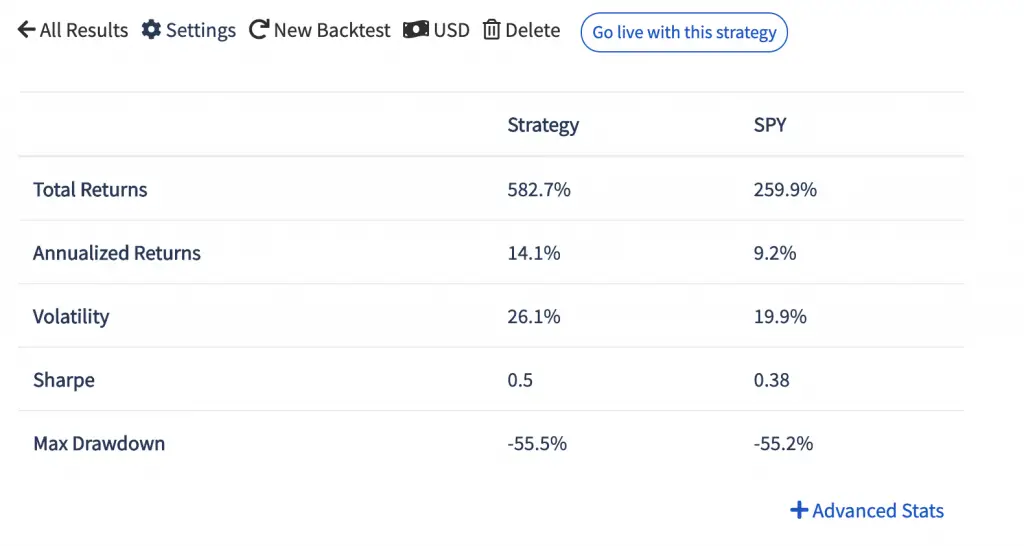
You can view a graphical approach as well.
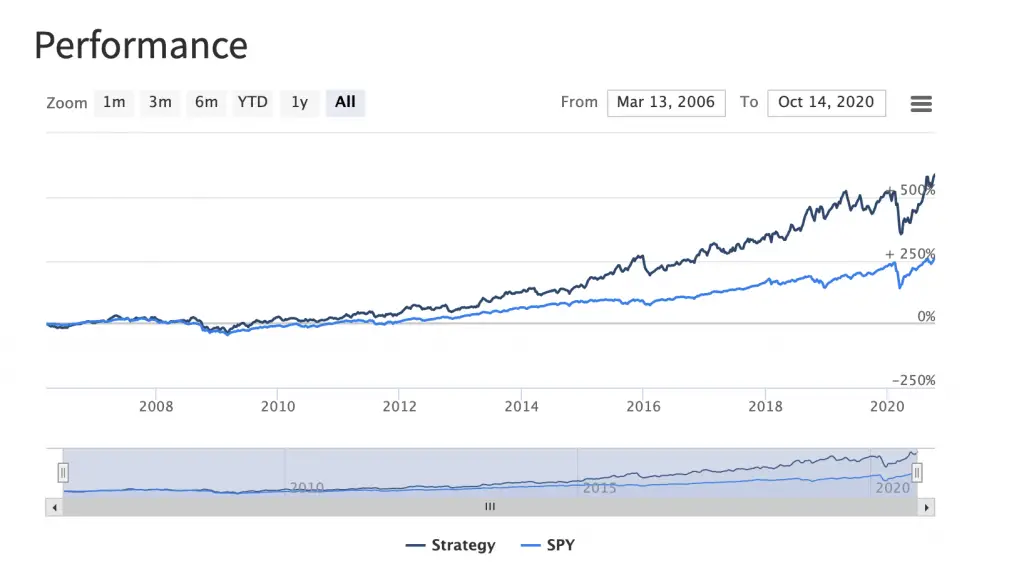
These numbers depend on the time period that you choose.
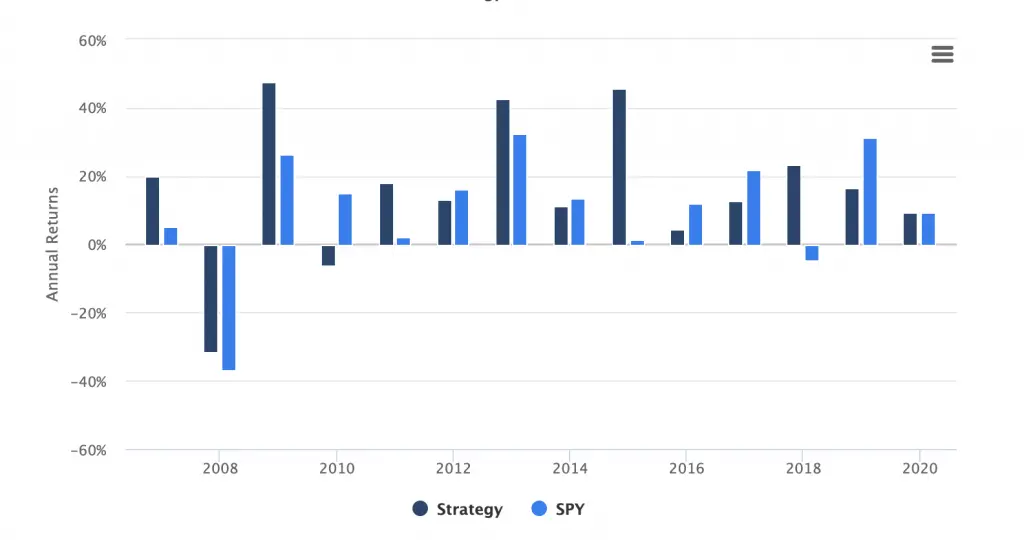
#2 Annual returns
You can compare the annual returns of your strategy against the benchmark.
#3 View the allocation
This allows you to see the current positions you should have in your portfolio. This is based on your investment universe and backtest strategy.
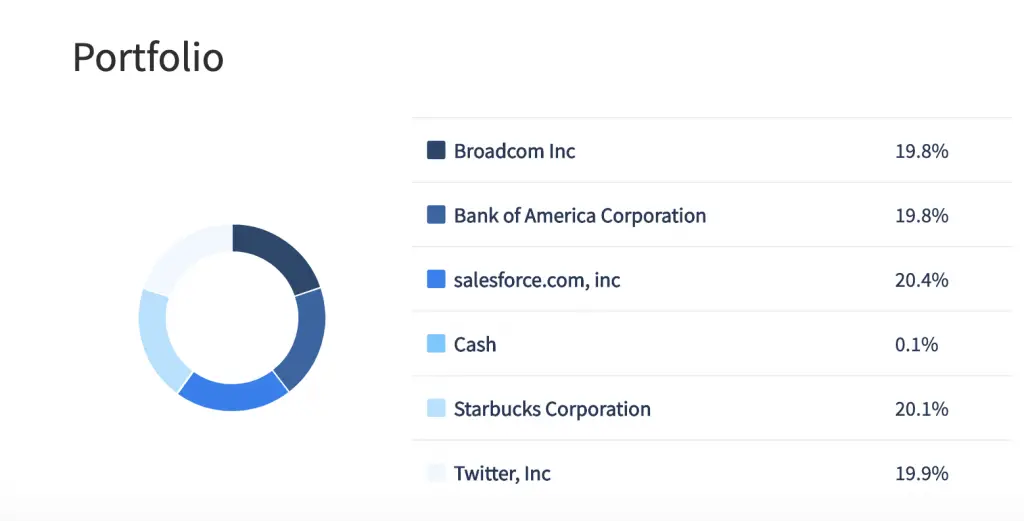
For example, if you have $5000, around $1000 should be placed in each stock.
The number of units that you buy depends on the price of each stock.
#4 View how the positions have changed over time
You can see how the positions of your holdings have changed over time.
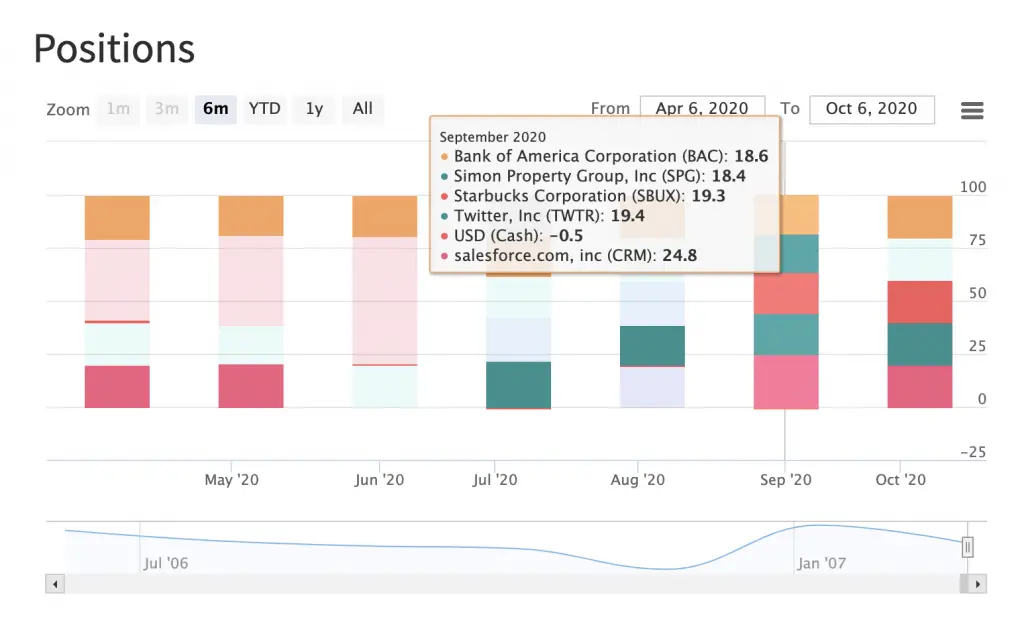
The stocks in your portfolio will change based on the parameters that you’ve previously set.
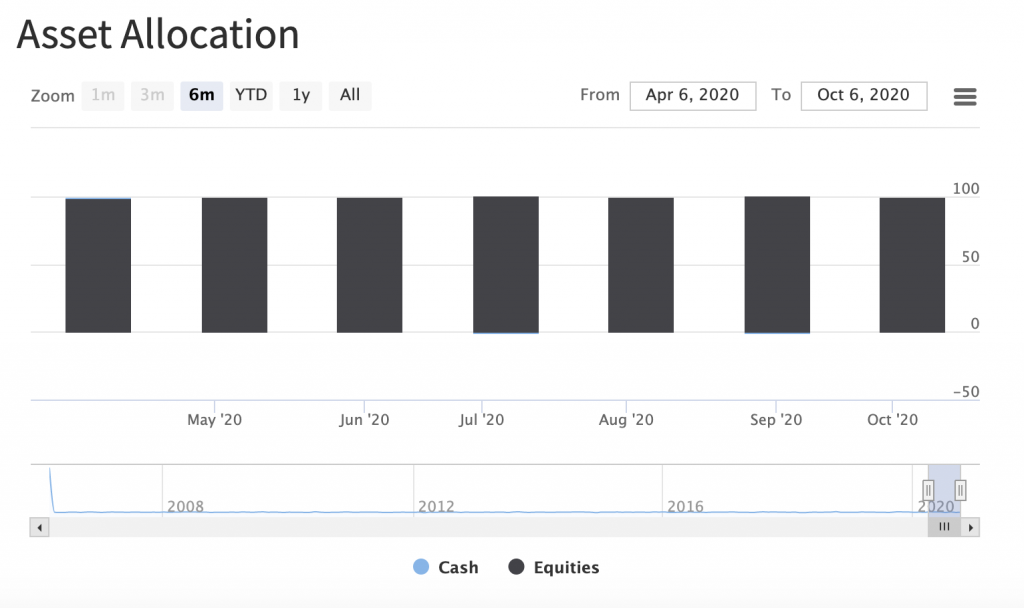
#5 View how the asset allocation has changed
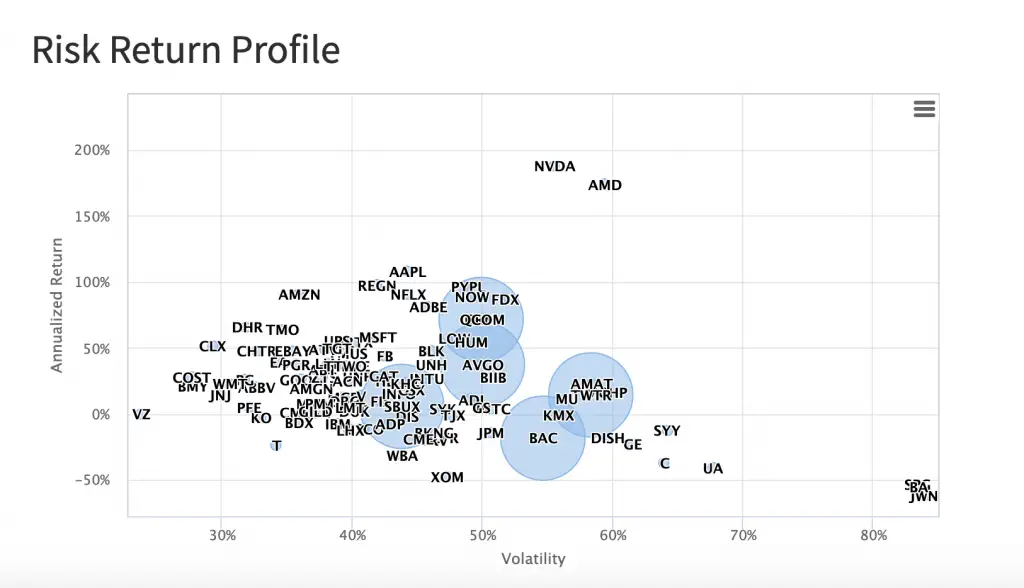
#6 View the risk-return profile
You can view the performance of each stock.
Here are the 3 parameters for this bubble chart:
- y-axis: annualised return
- x-axis: volatility
- Bubble: weightage of stock in your portfolio
#5 Live Trading (Create Your Own Robo-Advisor)
If you are happy with your strategy, you can go live with it.
This feature is only available for Premium members.
You would need to click the ‘Go live with this strategy’ button.
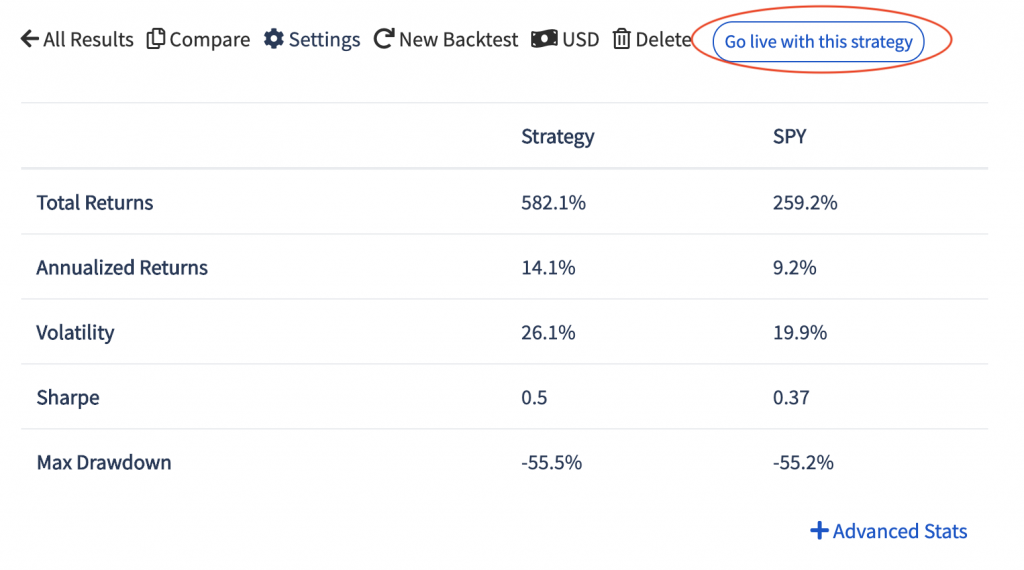
You will be asked how much money you have in your portfolio.
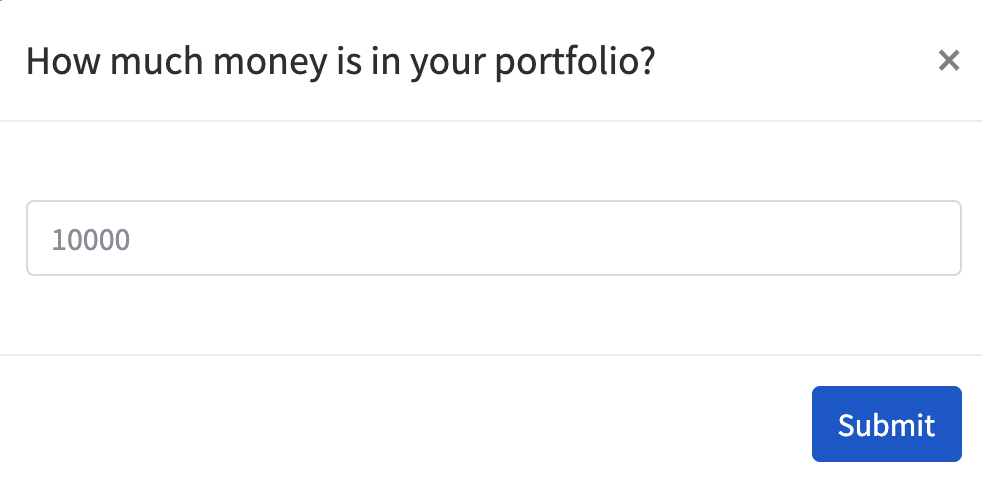
After clicking submit, your strategy will now be live.
You are able to view your live strategies under the ‘Live’ tab.
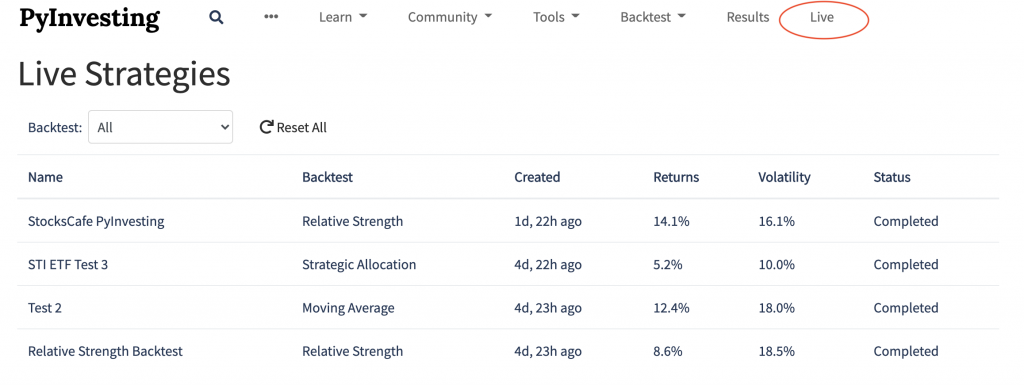
You will receive orders to make based on your strategy via email.
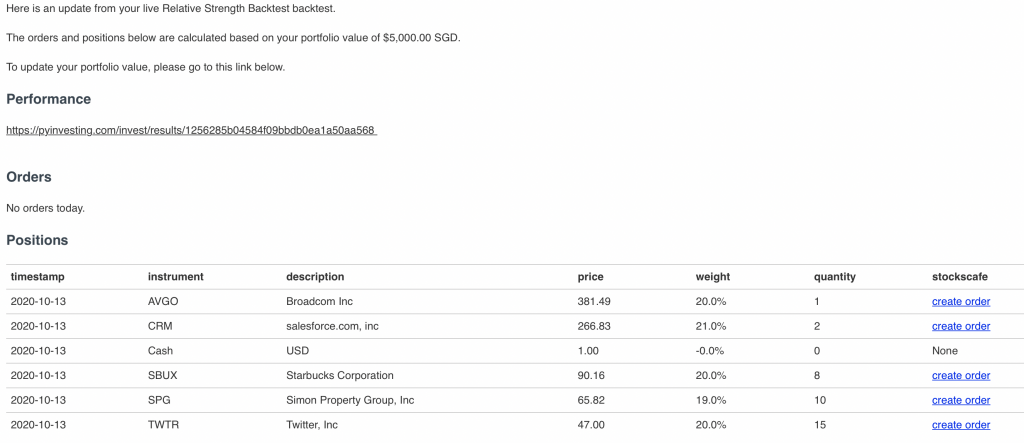
The email will advise you on the orders to make during the day. If you’ve just created the portfolio, you can follow the recommended positions and make the trades listed.
You may want to take note that these positions are only what the platform advises you to make. You will still have to make these trades in your trading account!
Build your own robo-advisor
Moreover, PyInvesting can act as a ‘robo-advisor‘ too.
Usually, robo-advisors have their own strategies that you have to follow. However, PyInvesting will advise you based on the strategy that you’ve set.
PyInvesting will also help you to rebalance your portfolio. This helps to see if the stocks in your portfolio are still performing the best based on your strategy.
Here are when the rebalancing occurs, based on the frequency you chose.
| Frequency | Rebalancing time |
|---|---|
| Weekly | Every Wednesday |
| Monthly | Every First Day of Each Month |
| Yearly | Every First Day of the Year |
In addition to the positions that you already have, you will have an additional section that advises you on the orders to make for the rebalance.
Here’s an example of the orders section in the email:
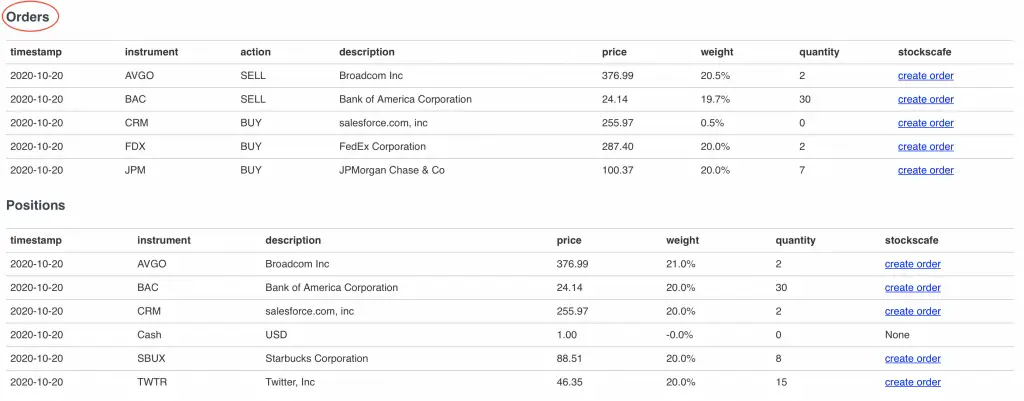
This can be a bit confusing as the positions section shows your positions before you make the new orders.
In this example, PyInvesting is advising you to sell 2 stocks (Broadcom and Bank of America). You are then advised to buy 2 new stocks (FedEx and JPMorgan).
As such, PyInvesting ensures that the stocks in your portfolio are the best picks based on your strategy.
#6 Integration with StocksCafe
If you have a StocksCafe account, you are able to use both PyInvesting and StocksCafe together.
With these 2 websites, you can:
- Create your backtest strategy (PyInvesting)
- Monitor your strategy’s performance (StocksCafe)
Here’s a step-by-step guide on how to use them together.
1. Use StocksCafe’s screener
To access StocksCafe’s screener, you will need to go to ‘Tools → Screener‘.
You can build your screener or choose a publicly shared screener. In this example, I will be using the Dividend Stocks Screener by My Sweet Retirement.
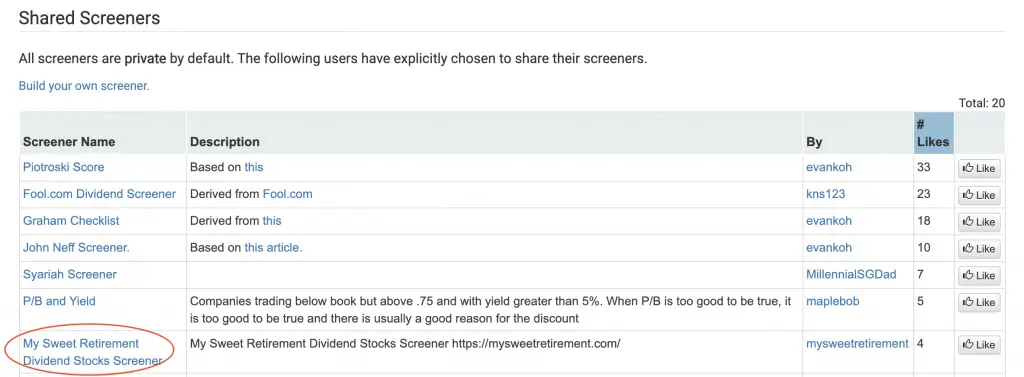
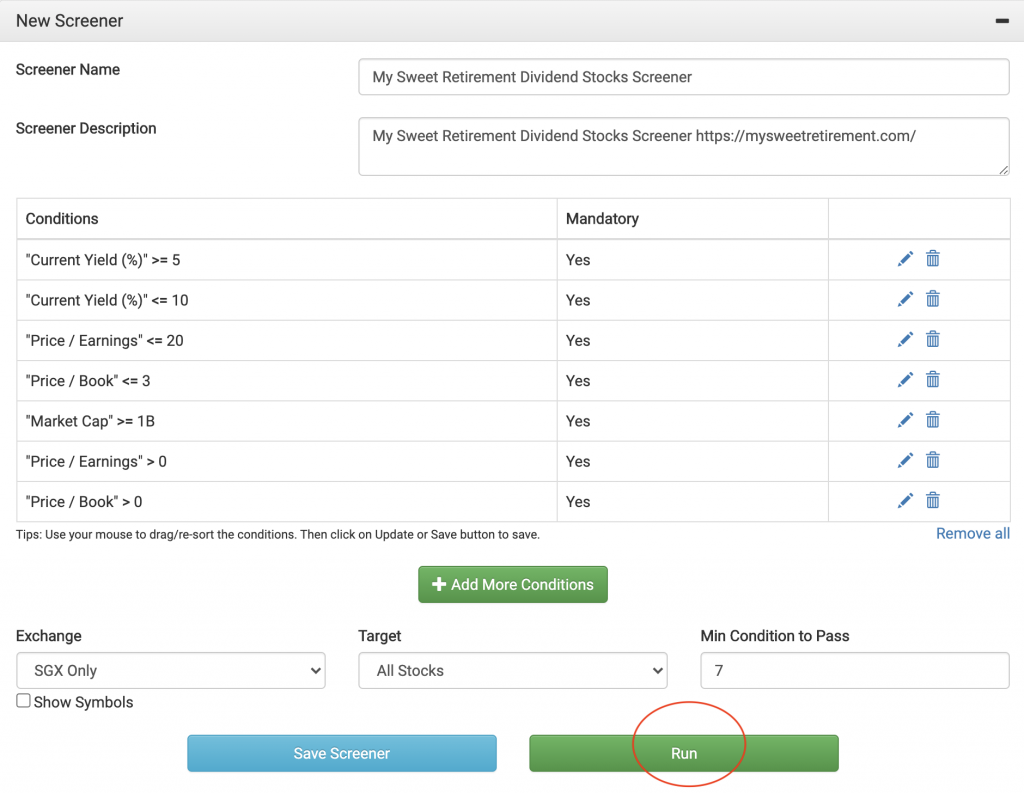
Here are a few things that you can do:
- Edit the parameters
- Choose which exchange you want to screen
When you’re done, you can click the Run button.
You will be able to see the results section. Based on the parameters, there are 17 stocks that passed this screen.
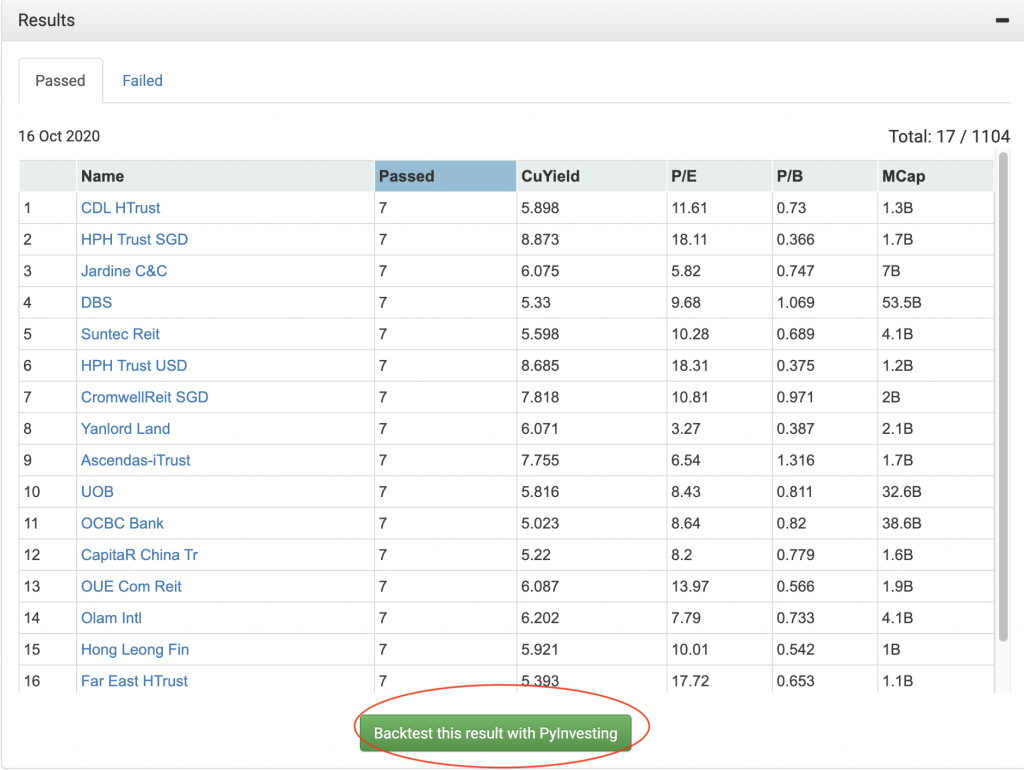
If you’re happy with this list of screened stocks, you can choose to run this backtest using PyInvesting.
2. Choose which backtest strategy to use (PyInvesting)
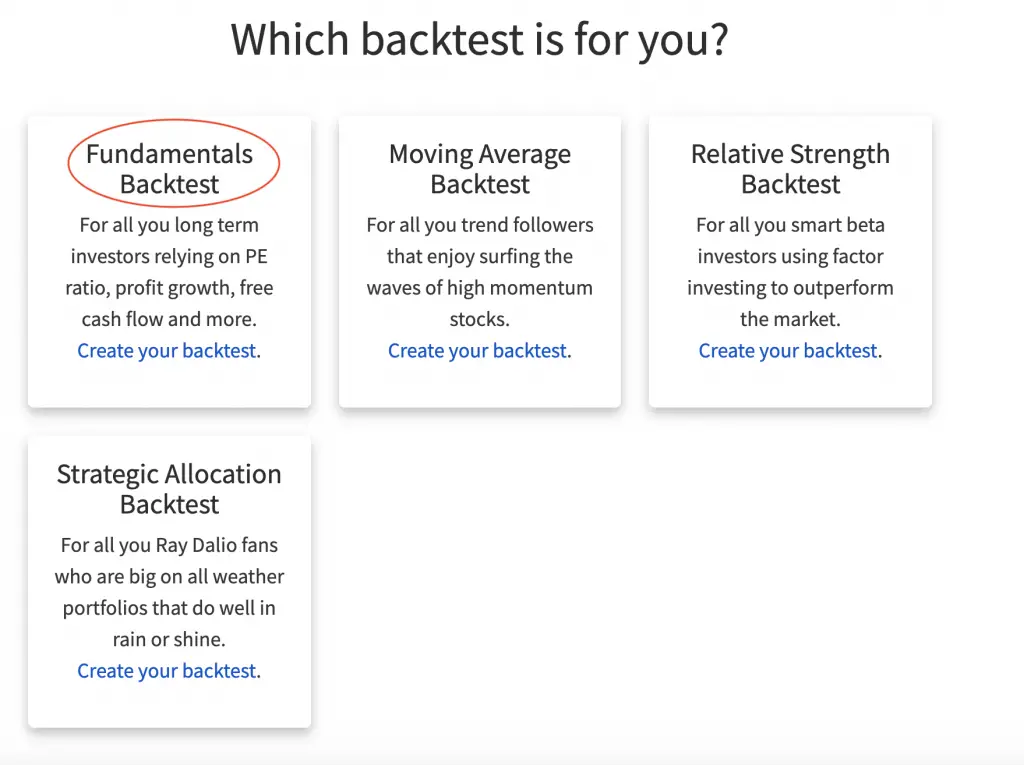
You will be redirected to the PyInvesting site, where you will be asked to choose one of the 4 strategies.
In this example, I will be using the Fundamentals Backtest.
The stocks from your screener will already be selected.
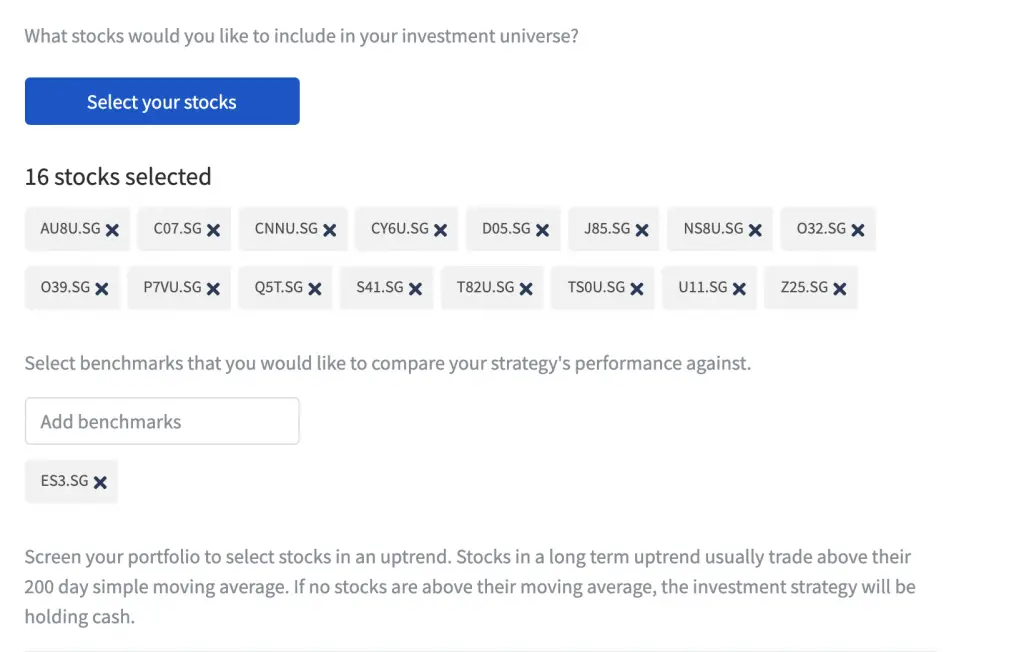
Only the stocks that pass your screen will be added into your investment universe.
Similar to above, you can allocate the weights of each trading signal.
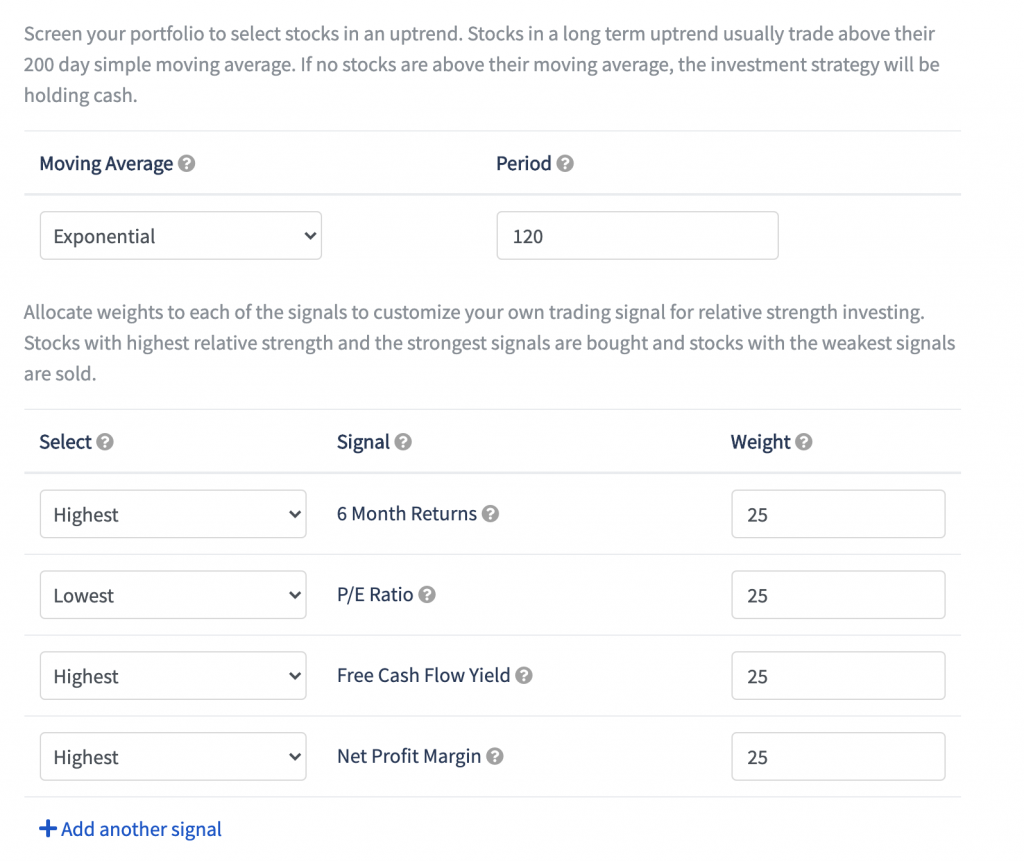
You will then be able to run your backtest.
3. Review backtest results (PyInvesting)
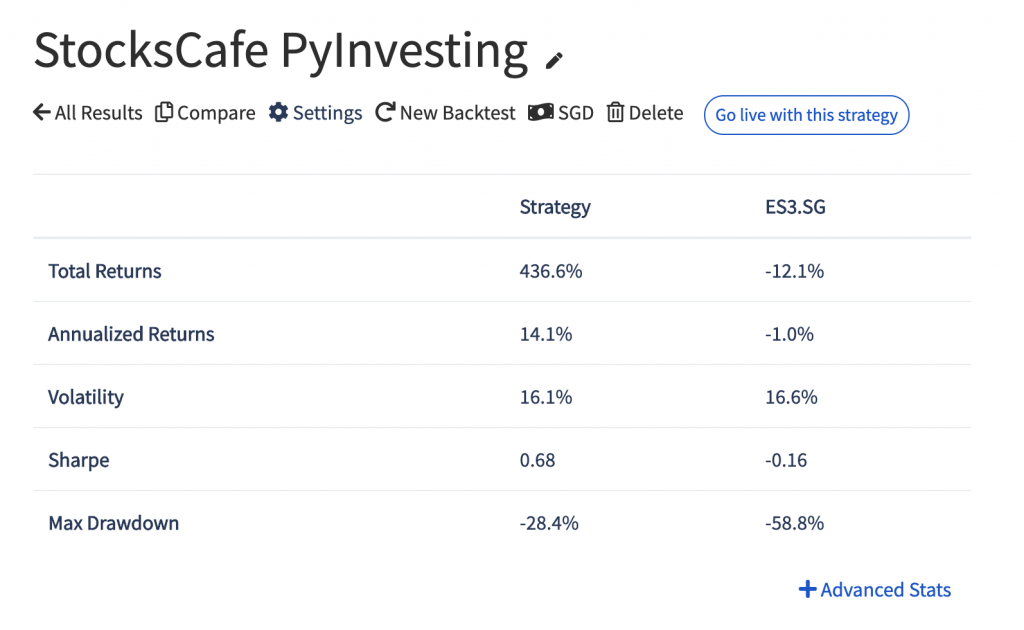
Once your backtest has run, you can see how it performs against the benchmark.
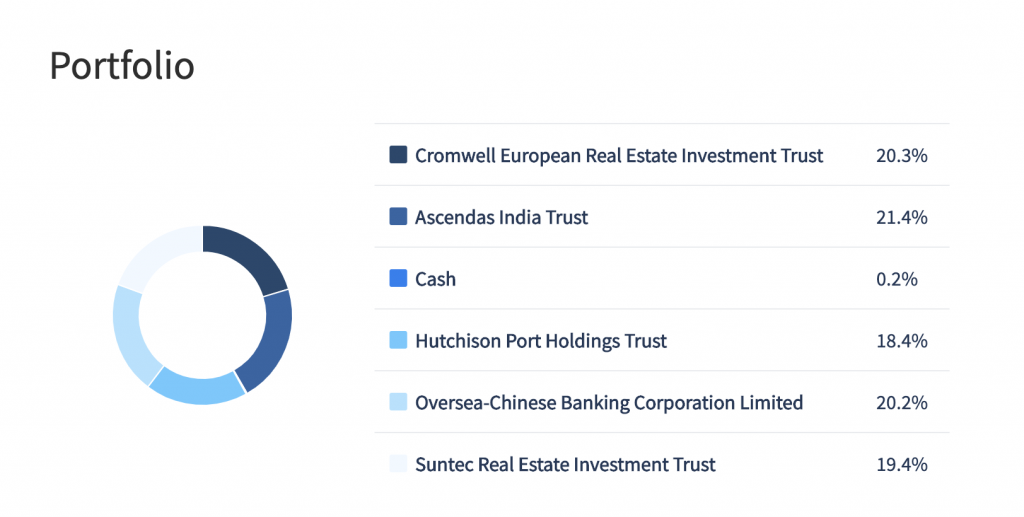
You can see which stocks have been chosen in your portfolio.
If you’re happy with the performance, you can choose to go live with this strategy.
4. Run your backtest strategy (PyInvesting)
Once you go live with your strategy, you will receive an email. This shows you the recommended allocation to each stock.

The amount that you invest into each stock depends on the amount that you’ve allocated into the portfolio.
Based on your rebalancing frequency, you will be advised to make certain trades in the market.
5. Monitor your strategy’s performance (StocksCafe)
In the email, there is a StocksCafe column on the far right.
When you click on the link, you will be redirected to StocksCafe to add your transactions.
Some of the information will already be added for you.
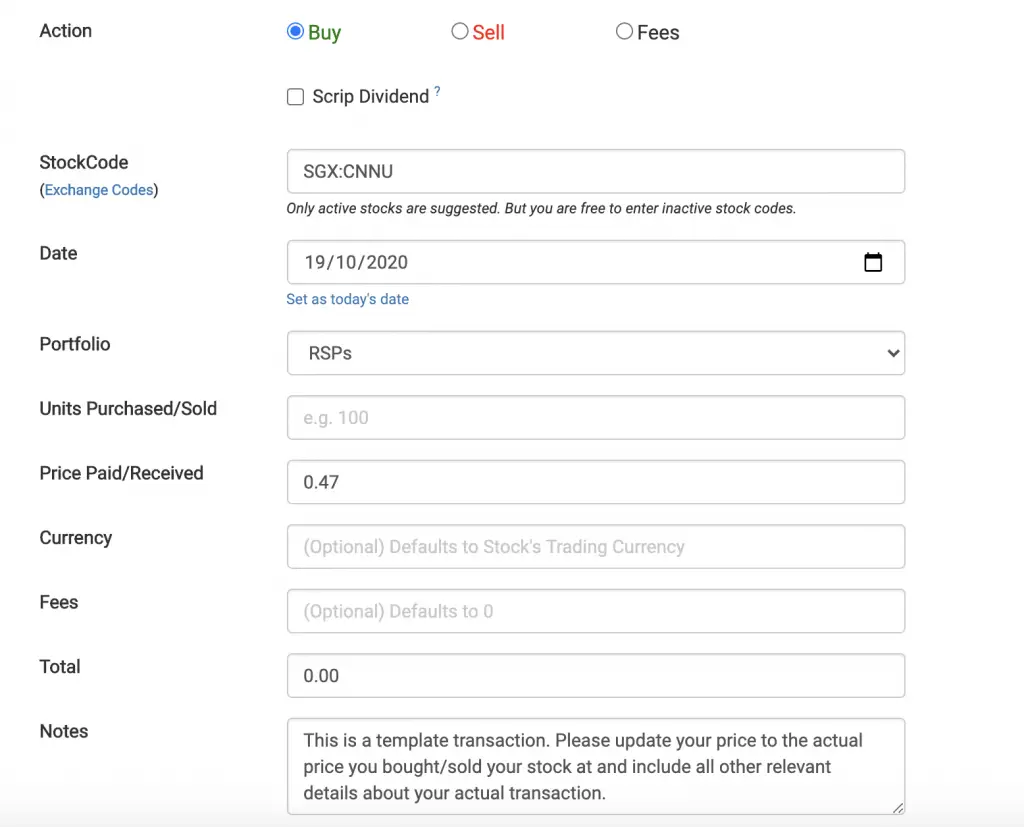
However, you’ll need to add:
- Units you’ve purchased
- Price you’ve purchased at
- Transaction fees that you’ve incurred
After adding all of your transactions, you are able to track your portfolio’s performance on StocksCafe.
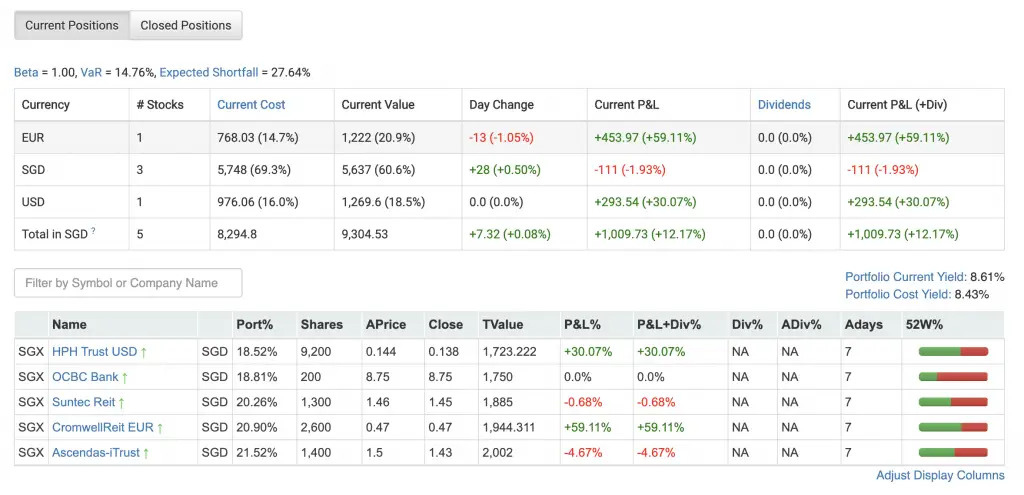
This makes it really easy to see how well your portfolio is doing.
What are the plans and pricing available?
PyInvesting has two main plans, Starter and Premium.
Here is the comparison between the 2 plans:
| Comparison | Starter | Premium |
|---|---|---|
| Price | Free | $15/mth |
| Max number of backtests per day | 3 | Unlimited |
| Backtest positions and performance | Delayed by 1 year | Real time |
| Going live with your strategy | ✕ | ✓ |
If you are a serious trader, I would recommend you to get the Premium plan. Although I do not have any experience in trading, I found the platform really easy to use.
If you wish to try the Premium plan, you can sign up for PyInvesting using my link.
You will be able to get a 20% discount for each month. This means you’ll be paying $12/month instead!
Conclusion
PyInvesting is a platform that allows you to adopt a data driven approach to investing.
This is a rather new platform, and there were a few technical glitches that I found along the way. Nevertheless, the premium plan has tons of features that will appeal to traders and value investors.
However, if you are a beginner investor like me, this may not be the best platform for you. There are many terms that you may not be familiar with, and you may not use this platform to its full potential!
Furthermore, you may be investing for the long term. As such, having a platform that checks your stocks everyday may not be ideal for you.
I will only recommend this platform if you are familiar with the various stock metrics. If you are interested to learn more about trading, I would suggest to read up a bit more first!
PyInvesting Referral (Discounted Price For Life)
If you are interested in signing up for the PyInvesting platform, you can use my referral link to create your account.
You will receive a 20% discount on your Premium plan. This means that you will only need to pay $12/month instead of the original $15/month.

Do you like the content on this blog?
To receive the latest updates from my blog and personal finance in general, you can follow me on my Telegram channels (Personal Finance or Crypto) and Facebook.
Are you passionate about personal finance and want to earn some flexible income?

