Last updated on August 21st, 2021
In the US stock exchange, there are many ETFs out there that you can choose from. Among them are QQQ and DIA. Both of them have been incepted around the same time and they are both passively managed ETFs. Nonetheless, QQQ is popular among investors while DIA is not. If you are choosing between these two ETFs, it may be hard to decide without knowing more about them.
In this article, I will be comparing their differences in depth so that you have an easier time finding out which ETF is more suitable for you.
Contents
The difference between QQQ and DIA
Both QQQ and DIA are US-listed ETFs that track large cap companies and they are passively managed. However, they differ in many aspects as well. For example, QQQ has more holdings than DIA, while DIA has higher dividend yields and lower fees compared to QQQ.
Before I do a thorough comparison, let’s find out more about each of them first.
Background
Here is a brief description of both of these ETFs:
QQQ
Back in March 1999, the QQQ ETF is launched by Invesco. As it tracks the Nasdaq-100 Index, it has also became one of the most popular ETFs in the US ever since. Specifically, it is the 2nd most actively traded ETF in the US.
The Nasdaq-100 Index contains the largest 100 non-financial companies in the Nasdaq stock exchange. Their sizes are based on market capitalization.
If you are looking to invest in financial companies, you can consider looking at ETFs that track the Nasdaq Financial-100 index.
In the past, the QQQ ETF has been able to make great returns for investors during bull markets. However, it has also caused investors to suffer losses when a bear market appears.
DIA
On the other hand, the DIA tracks the SPDR Dow Jones Industrial Average (DJIA). It was incepted back in January 1998 by State Street Global Advisers.
DIA happens to be the only ETF tracking the Dow. It is among the oldest and most followed index in the US. It contains the largest 30 companies in the New York Stock Exchange and the Nasdaq based on market price.
From here, you can see that both ETFs are tracking different indexes. Also. different investment management companies are managing it.
With a basic background of these two ETFs, let’s go deeper into their differences:
Holdings
Scrutinising the holdings within the fund or the index can tell us many things. This includes:
- the sectors that are included in the index
- the weightage of each company in the fund
- the number of holdings in each fund
Zooming out for a better view, you can then make certain assessments about the fund. That includes the amount of risk and the expectations for its performance.
For both QQQ and DIA, their holdings are spread across various sectors. This can be attractive if you are looking to diversify their risks in the market. It can also protect you in the event that any one company goes bust and their stock price takes a dive.
QQQ’s portfolio is categorized as such:
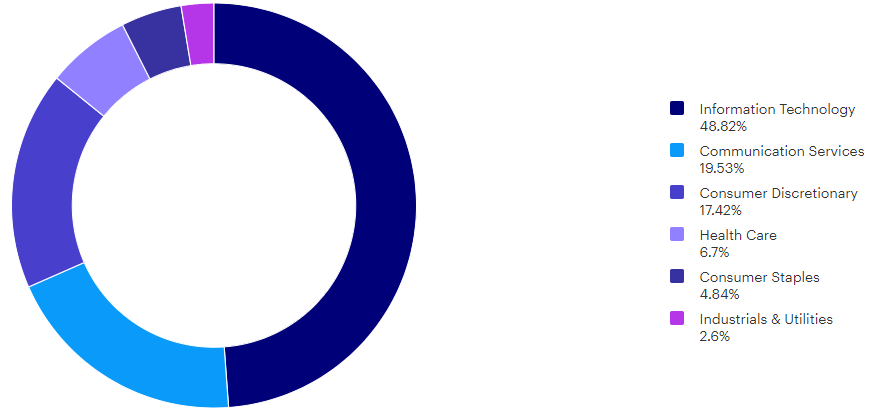
Information technology takes up almost half of the fund!
You can see that the ETF is growth-oriented in this technological age.
Some of QQQ’s top holdings include technology companies like Apple, Microsoft and Amazon.
An important holding is Apple, who became the first U.S. company to reach a market capitalization of $2 trillion. Moreover, Microsoft and Amazon are strong companies that have robust cash flow. All these factors have helped to boost QQQ’s popularity and performance.
What draws investors to QQQ ETF is that you can own all these great companies at a fraction of the total cost.
For DIA, these are the sectors they are in:
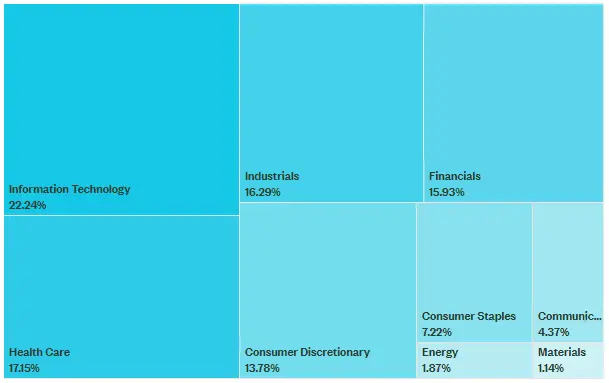
You can see that their companies are more distributed with no particular sector above 25%. Again, information technology companies occupy the most in the fund.
With a total of 30 companies, they provide much lower diversification compared to other ETFs. This can be good or bad depending on what you are looking for.
While technology is the major sector in this fund, the top holdings are actually not technology companies!
Moreover, all of DIA’s holdings are blue-chip stocks.
Blue-chip stocks are large, well-established companies that have operated for many years
Investopedia
As they have been around for a long time, their days of high growth rates are also behind them.
More importantly, the companies serve key functions in people’s daily lives. They are able to withstand adverse market conditions and economic downturns.
By understanding the holdings in depth, you can begin to see several key differences in the funds. They would also attract different investors depending on what they are looking for.
AUM
The Assets Under Management (AUM) metric refers to the managed amount of market value. This is used to provide a clue to the size of the fund.
A difference in fund size can tell you about the popularity and optimism levels of the funds.
The larger the size, the more popular the fund is and the more investors are optimistic about it.
Moreover, AUM can be compared across funds to indicate the strength of the fund company. They provide insights into the skills and experience behind the fund management.
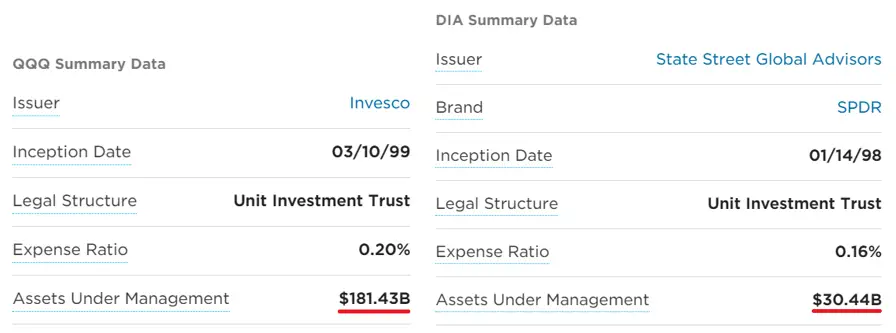
From here, you can see that QQQ’s assets are nearly six times as much as DIA’s!
As for its popularity, optimism and strength, QQQ has won this hands down.
Leading to the next point, the AUM metric is also proportional to its trading volume.
Average Trading Volume
The trading volume of a fund measures the total number of shares that was bought and sold in a given time. This can tell us about how active the fund is and its liquidity.
The higher the trading volume, the higher its liquidity.
Liquidity describes the degree to which an asset can be quickly bought or sold in the market at a price
Investopedia
Low liquidity also means that investors are not able to sell the stock they are holding at a certain price. This is particularly important if you’re a trader who buys and sells frequently. For non-traders, it also helps to keep this in mind when choosing between ETFs.
The 65-day average trading volumes for QQQ and DIA are listed below:
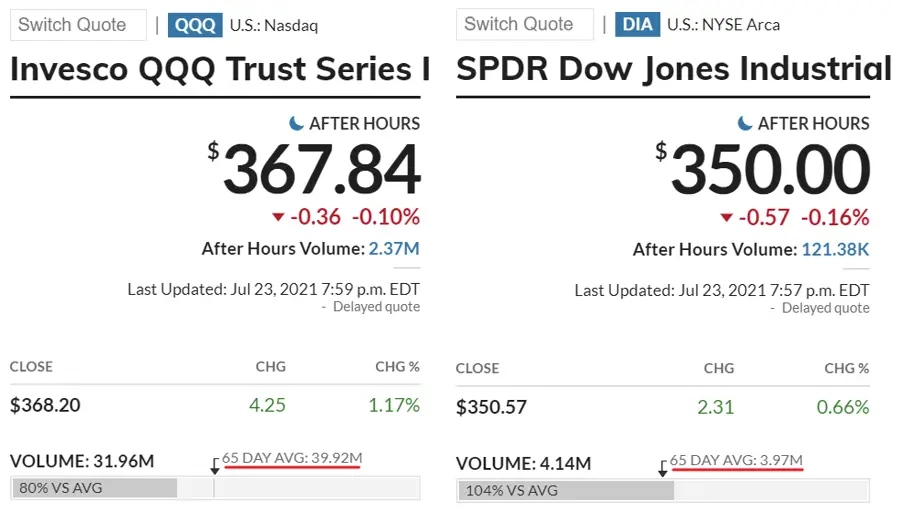
QQQ trades about 10 times more than DIA!
This difference reflects how easy it is to trade QQQ as compared to DIA. Nevertheless, both stocks have a rather high trading volume. This means that you should be able to buy or sell either ETF at your intended price.
Unit Prices
Unit prices can be important because they determine the amount of money you pay for buying one unit of the fund.
That said, the prices can be a bargain considering that you can own many companies at once!
If the unit price of one ETF is cheaper than another, then the former would be more attractive to you as an investor.
As of late July 2021, their prices are as such:

Since their prices are quite similar, there is no need for them to affect your decision process.
You may want to note that the prices are in USD, so it can be more expensive in your native currency.
Besides, prices can fluctuate throughout the day. Sometimes, the price of an ETF can also be selling above its intrinsic value. As such, you would want to wait for it to correct downwards. Importantly, it would help to know what is the right price before you buy them.
Performance
The past performance of an ETF can often be a rough guide as to how it will perform in the future.
Here are the 5-year past performances of QQQ and DIA from July 2021:
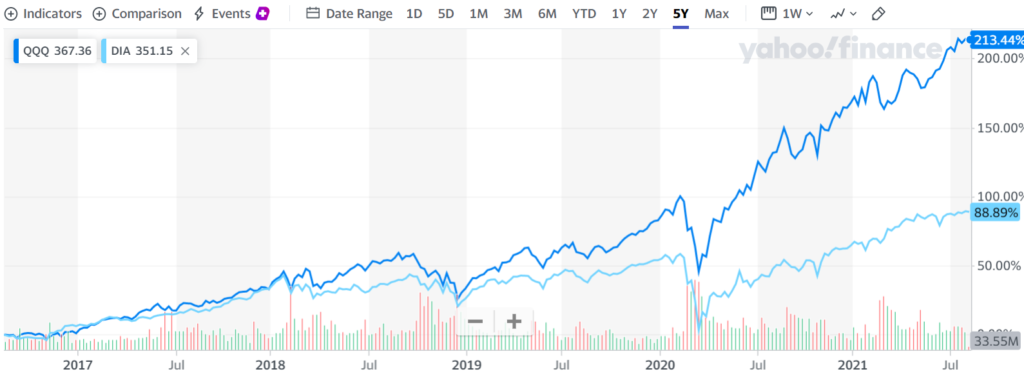
On plain sight, you can see that QQQ’s stock performance generally fares better than DIA from 2017 to 2020. It was only after the appearance of COVID-19 that QQQ’s stock price grew by leaps and bounds.
While the rebound in early 2020 was unexpected, you also see that the stock prices are growing a lot after the COVID crash. Since the pandemic is not yet over, the current prices could be due to high optimism levels among others. Nonetheless, you cannot be sure that this upswing can continue further.
If you invested in QQQ, you generally would have enjoyed higher returns compared to someone who invested in DIA. However, this is not a clear reason to buy QQQ as they are other factors to look at.
As history would teach us, the market can be irrational at times. Stocks can swing up and down in an atmosphere of greed and fear. This means that past performances cannot be fully relied upon to tell us the future.
Expense Ratio
The expense ratio measures the percentage of the fund’s assets that is used for operation and administrative purposes. It is also derived from the fund’s assets. You’ll need to take note that the expense ratio reduces your returns, so it is good to pay attention to it.

The expense ratio of QQQ is relatively higher than that of DIA. Both of them actually fall within the standard ratio among other passively-managed ETFs. The important thing to note here is that these expenses can accumulate over time. As such, it is beneficial to calculate how much you are paying and whether it is worth it.
Dividend Yield
Both QQQ and DIA distribute dividends to their investors on a consistent basis.
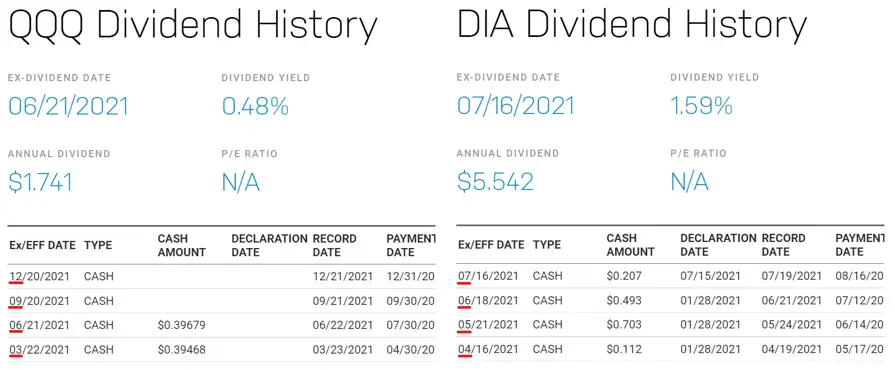
DIA’s annual dividend is 3 times more than QQQ!
This means that DIA would be much more attractive as a dividend investment.
With regards to their dividend schedule, you might want to note that QQQ makes quarterly dividend payments. In contrast, DIA does them monthly.
With all that said, there is a drawback for people who are not staying in the US. They will be subjected to a 30% withholding tax whenever they receive their dividends. That is almost one-third of the earnings which amount to a substantial sum over the long run!
Consequently, you may want to calculate how much returns you are left after deduction. You can calculate the actual annual dividend for the ETFs by subtracting the withholding tax from the annual dividend.
These are the calculations for the two ETFs:
| QQQ | DIA | |
|---|---|---|
| Estimated Annual Dividend (USD) | 1.74 | 5.54 |
| Cost of Withholding Tax (USD) | 0.52 | 1.66 |
| Estimated Actual Annual Dividend (USD) | 1.22 | 3.88 |
DIA’s dividend yield may be higher than that of QQQ. However, the amount deducted by the dividend withholding tax is also on the same scale.
The dividend withholding tax is overall a huge deterrent for non-US investors to invest in the US for dividends.
Estate Tax
The estate tax is yet another regulation that applies to all non-US investors. If the investor passes away while possessing money in US ETFs, the amount will be subjected up to a 40% levy! This is definitely something that you do not want to ignore.
There are other products like UCITS ETFs that were able to skirt around this estate tax. Yet, they also come with their own setbacks. As a result, you would need to weigh your options to figure out which strategy is the best for you.
Verdict
After comparing many aspects of the ETFs, here is a snapshot of their differences:
| QQQ | DIA | |
|---|---|---|
| Fund Manager | Invesco | State Street Global Advisers |
| Number of Holdings | 102 | 30 |
| Top 3 Sectors | Information Technology Communication Services Consumer Discretionary | Information Technology Health Care Industrials |
| AUM (billions) | 181.43 | 30.44 |
| Average Trading Volume (millions) | 39.92 | 3.97 |
| Unit Price (USD) | 368.20 | 350.57 |
| Performance | High | Low |
| Expense Ratio | 0.20% | 0.16% |
| Dividend Yield | 0.48% | 1.59% |
So which ETF is more suitable for you?
Choose QQQ if you are growth-oriented
Growth investors might want to consider QQQ in their portfolio. As the fund is quite invested in technological companies, it is well-placed to capture the growth rates of the technology sector. At the same time, its portfolio of sectors help to reduce its market risk through diversification.
You can also consider the ARKK ETF which is actively managed and focuses on innovation!
Furthermore, its high AUM and trading volume speaks of its popularity among investors. This would elevate its liquidity as well.
As for its expense ratio, it is also considered reasonable among other ETFs.
Looking at its past performance, you can see its ability to bring huge returns to its investors. But, it is also considered to be overvalued at this point in time to buy in. Waiting for it to drop might be a wise choice.
Choose DIA if you prefer low-risk investments
DIA is not a popular ETF nowadays. This is seen through their AUM and trading volume.
One reason could be that its holdings consist of blue-chip companies. This would cause them to have difficulties growing much further. Despite that, you would know that these companies are able to withstand economic downturns.
DIA is also much less diversified than QQQ with only 30 companies. Even so, the portfolio of stable companies would not warrant too much risk. Hence, there is less concern as well.
Also, it is worthy to mention that its expense ratio is lower and its dividend yield is much higher than QQQ. Its dividends particularly helps to give you some returns, even if it does not grow much in price. All of these features help to brand it as a more suitable choice for low-risk or dividend investors.
Conclusion
To conclude, both QQQ and DIA are passively-managed ETFs. There is no right or wrong answer to which ETF is better compared to the other.
Instead, each ETF is suited to a different investment strategy that you intend to use!

Do you like the content on this blog?
To receive the latest updates, you can follow us on our Telegram channels (Personal Finance or Crypto) and Facebook.
Are you passionate about personal finance and want to earn some flexible income?


