Last updated on July 27th, 2021
You may have heard of the rise of tech companies within the US and you want to invest in an ETF to capitalise on their growth. However, you are still undecided between the new kid in the block, the ARK Innovation ETF (ARKK) or the stalwart Invesco QQQ ETF (QQQ).
What are the key differences between these 2 ETFs and which one may be more suitable for you? Let’s find out!
Contents
The difference between ARKK and QQQ
The ARKK ETF is an actively managed ETF with an investment theme of ‘Disruptive Innovation’. Meanwhile, QQQ is a passively managed ETF which aims to track the NASDAQ 100 Index. ARKK offers investors the chance to outperform the market with greater risk while QQQ provides returns similar to that of the NASDAQ 100.
Fund Profile
First off, let’s do a comparison on the fund profile of each ETF:
1. ARKK
The ARKK ETF is an actively managed ETF containing companies which aim to change the future of the world through ‘Disruptive Innovation’. It is managed by ARK Investment Management LLC.
Companies exhibiting ‘Disruptive Innovation’ introduce technologically enabled new products or services that may transform how the world works.
ARKK is personally managed by its CEO and CIO, Catherine ‘Cathie’ Wood. After having over 40 years of experience in managing funds, Wood started ARK Investment Management with a firm conviction that disruptive innovation will yield large-scale investment opportunities.
People who want to succeed should think like a disrupter… That’s going to become more and more true, because so much is changing.
Catherine Wood
Within the theme of ‘Disruptive Innovation’, Wood identified 4 categories with the greatest return potential:
| Genomic Revolution | DNA Technologies |
| Industrial Innovation | Industrial innovation in energy, automation and manufacturing |
| Next Generation Internet | Shared technology, infrastructure and services |
| Fintech Innovation | Technology in increasing efficiency in financial services |
Companies invested in ARKK fall within these categories.
By investing in ARKK, you will be able to gain exposure to up and coming companies which may change the world.
2. QQQ
In contrast, QQQ is a passively managed ETF that tracks a particular index, the NASDAQ 100.
The Nasdaq 100 consists of the largest 100 non-financial companies listed on the Nasdaq stock exchange
The NASDAQ 100 index was created in 1985 along with the NASDAQ Financial-100 (which only tracks financial companies).
With its growth-oriented companies under its hood, the index it has generally enjoyed strong growth throughout the year, notably beating the S&P 500 Index 11 times over the past 13 years.
Apple is one of the four companies to remain in the NASDAQ 100 since its inception!
Presently, while the NASDAQ 100 consists of a wide spectrum of household name companies from Apple to Pepsico, most of its portfolio are weighed towards tech stocks. Therefore, the NASDAQ 100 (and QQQ) offers investors exposure to the most dominant tech companies in the world.
The QQQ Index itself was incepted on 1999. Managed by Invesco Ltd., it is the only ETF that tracks the NASDAQ 100 on equal weightage!
Against its peers in the large-cap growth fund category, QQQ has performed exceedingly well. One of the ETF’s most impressive ratings was being ranked 1st in 15-year total returns in a recent study by Lipper.
By investing in QQQ, you will be investing current global market leaders in the realms of technology.
Portfolio Comparison
A comparison of the 2 ETFs’ portfolios will be done on their number of holdings, sectors and holdings.
Number of holdings
As ARKK is an actively managed index, its number of holdings fluctuate from time to time. However, it will range between 35 – 55 holdings.
As of 16 June 2021, ARKK has a total of 51 holdings.
The number of holdings in QQQ however, stays relatively constant at 102.
You may wonder why QQQ has 102 holdings instead of 100. This is because some companies have multiple share classes that are included in the index.
This is conceptually similar to why the S&P 500 has 502 holdings instead of 500!
With a lower number of holdings, ARKK presents a greater concentration risk in its portfolio!
Sector Comparison
Tech companies can be found in many sectors of the stock market. Here is a comparison of the top 5 sectors found in ARKK and QQQ as of March 2021:
| ARKK | QQQ |
|---|---|
| Health care | IT |
| IT | Communication Services |
| Communication Services | Consumer Discretionary |
| Industrials | Health care |
| Financials | Consumer Staples |
For ARKK, its top sectors are in line with the categories found within its theme of ‘Disruptive Innovation‘. For example, stocks in the health care sector belong to ‘‘Genomic Revolution” and stocks in the IT sector may belong to ‘‘Next Generation Internet”.
On the other hand, the top sectors in QQQ reflect the dominant sectors within the US stock market, with the exception of financials.
Stocks from the financials sector are not found in QQQ, as it has been excluded from its reference index, the NASDAQ 100
The sector profile in both ETFs are somewhat similar, with 3 common sectors found within them (Health care, IT and Communication Services).
Holdings comparison
Here is a comparison of overlapping stocks between ARKK and QQQ using the ETF Research Center’s Fund Overlap tool:

Even though both ETFs are focused on tech companies, they only have 3 identical holdings between them. The vast difference in their holdings is due to the difference in fund rationales of the 2 ETFs.
This can be examined by their weighted average market capitalisation and top holdings:
Market capitalisation
With an emphasis of multi-cap exposure, ARKK invests widely across companies of different sizes. Here is the breakdown of its market capitalisation as of 31 March 2021:

With a diverse spread across companies of different market caps, its weighted average market capitalisation stands at $118 billion.
Companies with similar market caps of ARKK’s average are JD and Applied Materials (as of June 2021).
In contrast, QQQ invests in the largest 100 companies in the NASDAQ stock exchange. As a result, it has a larger weighted average market capitalisation of $780 billion.
This places QQQ’s average market cap somewhere in between the market caps of Tesla’s and Facebook’s (as of June 2021)
With their different fund rationales, bigger tech companies will feature in QQQ. Meanwhile, companies fulfilling ARK Investment’s theme of ‘Disruptive Innovation’ is the focus in ARKK.
Top holdings
To give you an idea of the companies you are investing in ARKK and QQQ, the top holdings of both ETFs are featured.
Here are the top 10 holdings for ARKK:
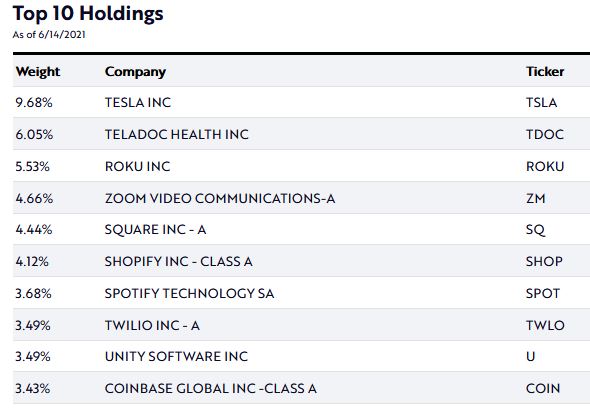
The top 10 holdings in ARKK feature companies which have gained fame over the recent years for the innovative products they offer.
For example, Tesla gained its success in pioneering electric cars. Meanwhile, Zoom changed the lives of people worldwide during the COVID 19 global pandemic with its widely popular teleconferencing software.
And here are the top 10 holdings for QQQ:
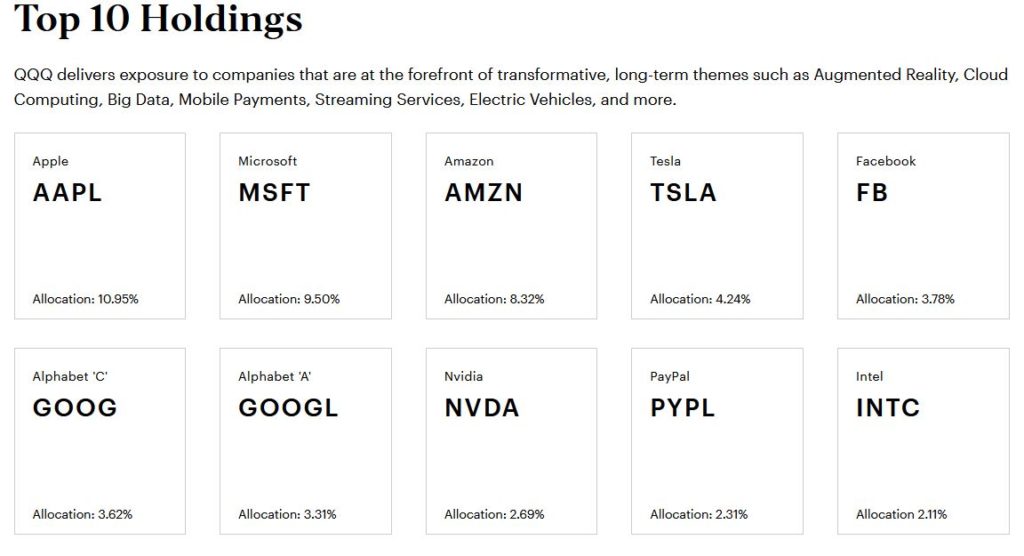
Within QQQ, the top 10 companies include companies that are established leaders in the market. In fact, when we think technology, these companies come to our mind first.
The following passage may sound familiar to you:
John turns on his computer which runs on Microsoft and an Nvidia graphic card to conduct research on Google. As he waits for the computer to start up, he uses his Apple phone to chat with his friends on Facebook and makes an online purchase on Amazon Prime through Paypal.
That is the extent of how dependent our lives are on these companies. Moreover, you are able to invest in all these leaders at one go with QQQ.
Unit Prices
The unit price is the price paid for one unit of ETF. When trading in US markets, the minimum lot size you can buy is 1.
A comparison of unit prices can help you determine which ETF is more affordable.
Here are the estimated unit price for each unit of ARKK and QQQ:
| ARKK | QQQ | |
|---|---|---|
| Unit Price | $115 | $340 |
With ARKK’s lower unit price, its barrier of entry is lower as it requires a smaller sum to start with.
Fees and taxes
Apart from costs you pay to your broker, the following are some of the more significant costs you will need to pay when investing in ARKK or QQQ.
Withholding Tax
Dividends are paid out by US ETFs from time to time. However, if you are a non-resident alien if the US, you will be subjected to a 30% withholding tax on your dividends.
One way to compare withholding taxes is to calculate the amount of withholding taxes paid relative to the ETF’s unit price. We will require the ETF’s dividend yield, and the withholding tax will be calculated as a proportion of it.
Here are the latest dividend yields and estimated withholding tax (per ETF unit) for the 2 ETFs as of 16 June 2021:
| ARKK | QQQ | |
|---|---|---|
| Dividend Yield | 1.77% | 0.52% |
| Estimated Withholding Tax | 0.53% | 0.16% |
From the above table, you will be paying a higher withholding tax for ARKK!
You may want to note that ARKK dividends are paid yearly (at the end of each calendar year). Meanwhile, QQQ dividends are paid quarterly.
Expense Ratio
Expense ratios are costs that you will need to pay to the fund manager in return for their services. Expense ratios in ETFs are worthy of comparison, as large values of expense ratios will eat into your returns.
Here are the expense ratios for the 2 ETFs:
| ARKK | QQQ | |
|---|---|---|
| Expense Ratio | 0.75% | 0.20% |
As ARKK is an actively managed ETF, more effort and costs are required for fund re-balancing. Therefore, its expense ratio is higher than that of QQQ’s, who passively tracks an index.
In fact, ARKK performs daily rebalancings of its portfolio! You can check out their latest activities on their website.
Liquidity
Information on the average trading volume will help you to understand the liquidity of the ETF, which may be helpful if you are an active trader.
The following are the average trading volumes for the 2 ETFs as of 16 June 2021:
| ARKK | QQQ | |
|---|---|---|
| Average Trading Volume | 11,329,663 | 44,361,004 |
As QQQ tracks a major index in the US, it has a higher trading volume and hence greater liquidity.
If you intend to trade ETFs using limit orders, QQQ may be a better choice for investing in, as you are able to buy or sell closer to the price that you want!
Performance
For all your investments, you may be most concerned about their performance; the risk that you are willing to take versus the amount of potential returns. Here is a comparison of the risk levels and past returns of the 2 ETFs.
However, past performance does not indicate future returns, so it’s important to do more extensive research before investing in an ETF!
Risk
While there are many ways to measure risks in an ETF, the worst historical loss of each ETF will be used in this comparison. For standardisation, only the period from 31st October 2014 (when ARKK was incepted) will be referred to. This is done to compare both ETFs under the same market conditions.
This form of measurement will give you an idea of the maximum amount of loss you can tolerate!
The next two graphs show the periods when both ETFs suffered their maximum losses:
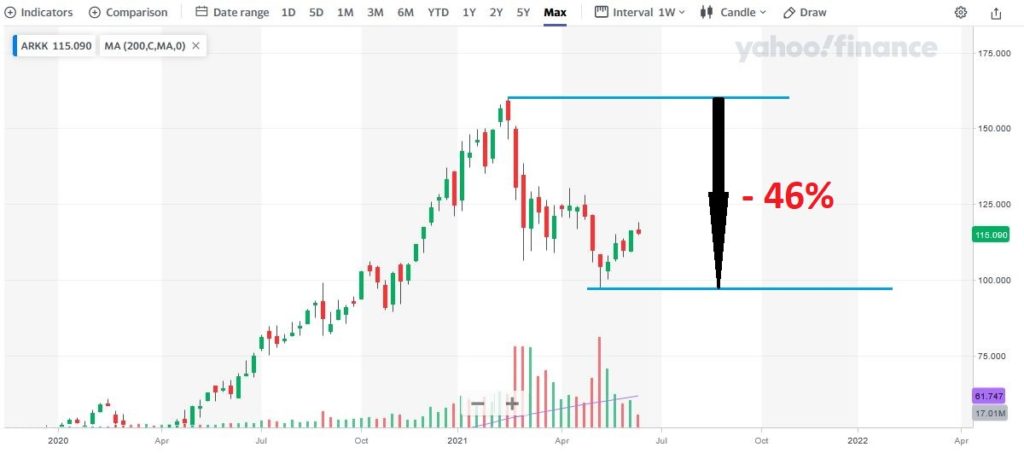
Between 16 Feb 2021 and 13 May 2021, ARKK suffered a loss of about 46%, or almost half its value! Meanwhile, QQQ suffered a loss of about 30% between 19 Feb 2020 and 23 Mar 2020.
This was at the height of the bear market during the COVID-19 crisis that year.
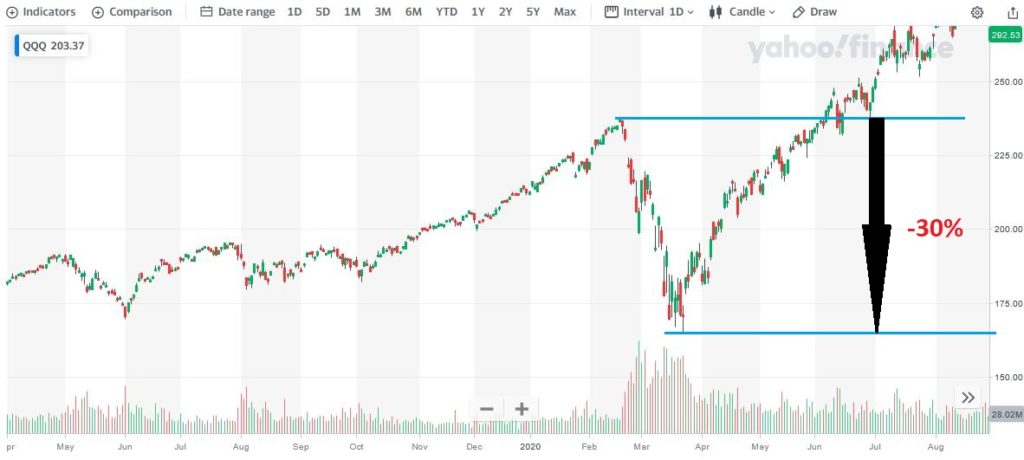
From this comparison, ARKK seems to be the riskier ETF. This is because it had suffered a larger maximum drop in price over the same market conditions.
Returns
The following shows the returns of ARKK and QQQ since the date of ARKK’s inception (31st Oct 2014).
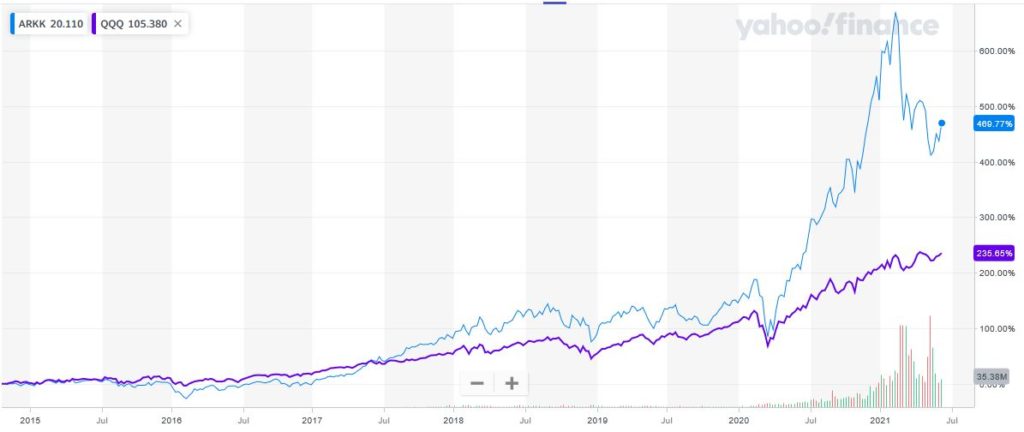
During this period, ARKK has returned more, making it the better performer in returns.
However, most of ARKK’s returns only occurred during the latter half of 2020. This is a relatively short period of time.
You may want to consider if ARKK is able to continue this stellar performance in the coming months or years ahead.
Verdict
Here is a summary of the comparison between ARKK and QQQ:
| ARKK | QQQ | |
|---|---|---|
| Fund Manager | ARK Investment Management | Invesco |
| Number of Holdings | 35 – 55 | 102 |
| Sector Comparison | Health care IT Communication Services Industrials Financials | IT Communication Services Consumer Discretionary Health care Consumer Staples |
| Portfolio Holdings | Small to mega cap equities exhibiting ‘Disruptive Innovation’ | Large and mega cap equities |
| Estimated Unit Price | $115 | $340 |
| Fees and Taxes | Higher | Lower |
| Liquidity (Volume) | 11,329,663 | 44,361,004 |
| Risk Level | Riskier | Safer |
| Potential Returns | Higher | Lower |
So which index is more suitable for you?
Choose ARKK if you want to outperform the market
The investment theme of ARKK is geared towards companies that are expected to disrupt the economy of the future. If the potential of these up and coming companies are not yet fully realised, the value of their stocks may rise strongly in future. This provides investors the opportunity to outperform the market.
With great returns comes great risks
On the other hand, a drawback of this approach is that most of these companies have poor financial fundamentals. The reason for this is that being new entrants in the market, their sales have not caught up with their spending made to develop the company.
For example, according to a website that tracks portfolios of ARK Investments, 35 companies in ARKK’s portfolio are still reporting negative earnings!
Companies with poor financial fundamentals are more likely to fail, resulting in huge losses for your investment!
ARKK is suitable to start with small amounts
However, it is possible for you to diversify into ARKK in small amounts with its relatively lower unit cost. This will allow you to gain exposure to the fund while minimising your risk!
Choose QQQ if you prefer a safer investment method
If you prefer to see your investments grow steadily at a rate comparable to the market, QQQ will be the better choice for you. With large and mega cap companies in the list having fought off most of their competitors, they are the dominant players in their playing fields.
QQQ is a great low cost investment tool
Compared to ARKK, QQQ has a lower expense ratio and withholding tax, making QQQ the cheaper way to invest in the world of tech stocks.
This comes at an advantage during bear markets, as the lower costs compounds your losses less badly!
QQQ is one of the most liquid ETFs available
Even within the world of ETFs, QQQ ranks highly in terms of its liquidity. In fact, on 31 March 2021, it was the second most traded ETF in the US in terms of average daily volume!
If you are a trader, this may be good news for you, as it allows you to trade closer to your intended price.
Conclusion
Both ETFs allow you to invest in tech stocks which aim to deliver above average returns in the long run.
Key considerations to note when selecting your choice of ETF include:
- Your risk levels
- Potential returns you want to achieve
- Costs that you are willing to pay
- The ETF’s liquidity

Do you like the content on this blog?
To receive the latest updates, you can follow us on our Telegram channels (Personal Finance or Crypto) and Facebook.
Are you passionate about personal finance and want to earn some flexible income?

