Last updated on March 8th, 2022
There are many Hang Seng Tech ETFs that are listed on the Hong Kong Stock Exchange.
How does 3067 and 3088 compare with each other?
Contents
The difference between 3067 and 3088
Both 3067 and 3088 track the Hang Seng Tech Index. While 3088 is managed by BlackRock and 3088 is managed by China Asset Management Co., their main difference lies in the expense ratio you’ll incur.
Here is an in-depth comparison between these 2 ETFs:
Fund manager
3067 is managed by BlackRock, while 3088 is managed by China Asset Management Co. (ChinaAMC).
ChinaAMC is one of China’s largest fund families.
Both 3067 and 3088 were listed in September 2020. As such, both of these ETFs are relatively new.
Index tracked
Both 3067 and 3088 track the Hang Seng Tech Index.
This index represents the 30 largest technology companies listed in Hong Kong.
To be included in this index, companies have to:
- Have a high business exposure to technology themes
- Pass the index’s screening criteria
These companies all originate from Greater China, and they have to be listed on the Main Board of the HKEX.
They will also have to meet at least one of the 3 criteria below:
- Technology-enabled business (e.g. via internet / mobile platform)
- R&D Expense to Revenue Ratio ≥ 5%
- YoY Revenue Growth ≥ 10%
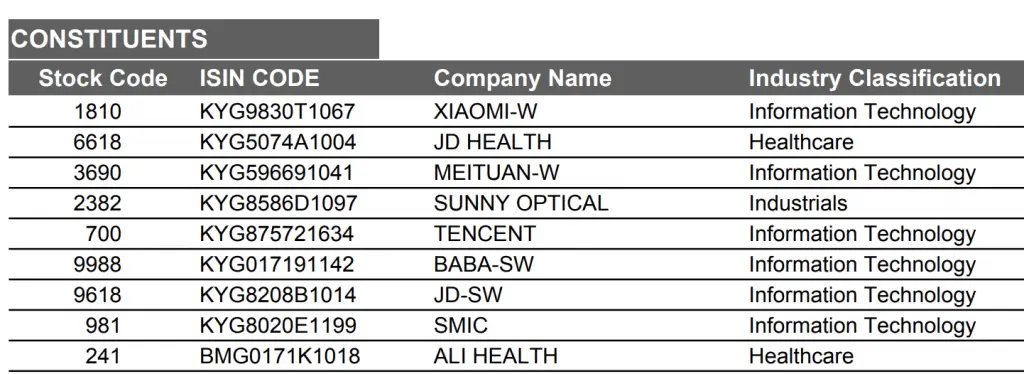
Here are some of the top holdings of this index:
This index was also created very recently in July 2020.
Both ETFs would hold the same stocks in the same proportion. As such, their performance should be very similar.
Exchange listing
Both 3067 and 3088 are listed on the HKSE. However, they do have some differences:
Minimum units to purchase
You are required to purchase a minimum of 100 units of 3067 on the HKEX.
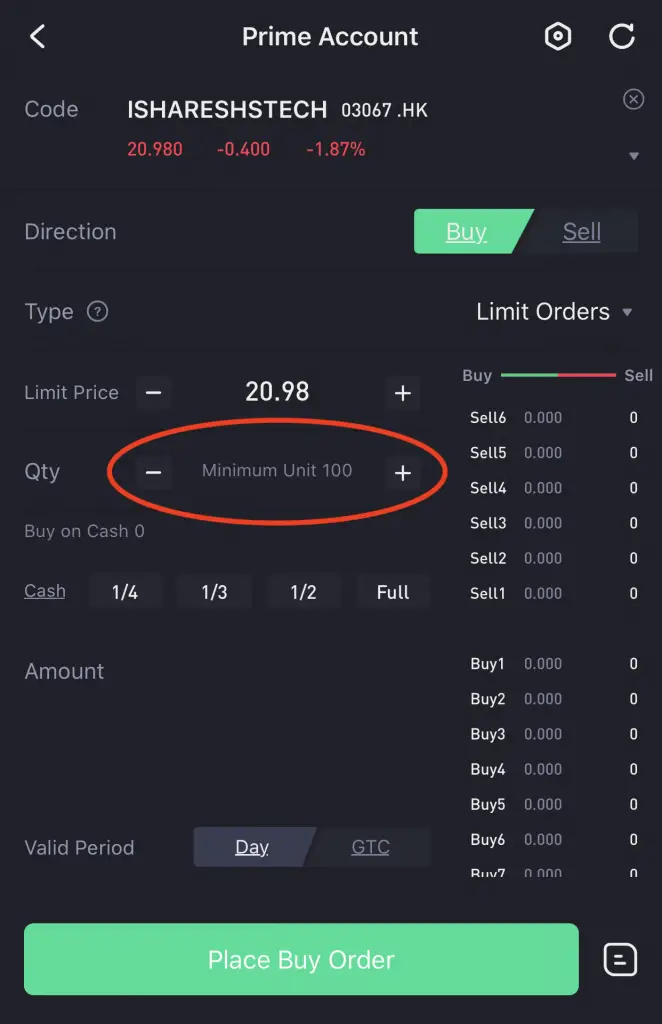
Meanwhile you require a minimum of 200 units to invest in 3088.
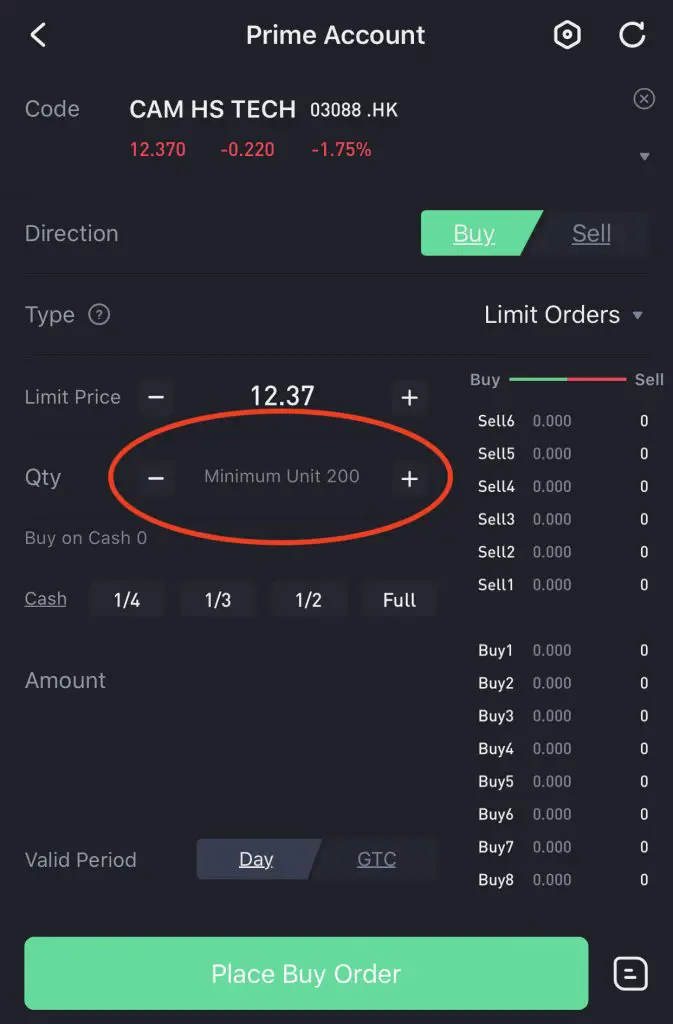
This difference in lot size is most likely due to the difference in unit price. 3067 costs almost twice as much as 3088.
3088 also has twice the minimum number of units to invest in. As such, both ETFs will have around the same minimum investment amount!
Even though both ETFs have different unit prices, it does not really matter in the end.
You can consider using Tiger Brokers to invest in the HKSE as it offers a minimum of 15 HKD per trade.
Dividend distribution
The dividend distribution of both ETFs is slightly different. 3067 aims to distribute any dividends semi-annually.
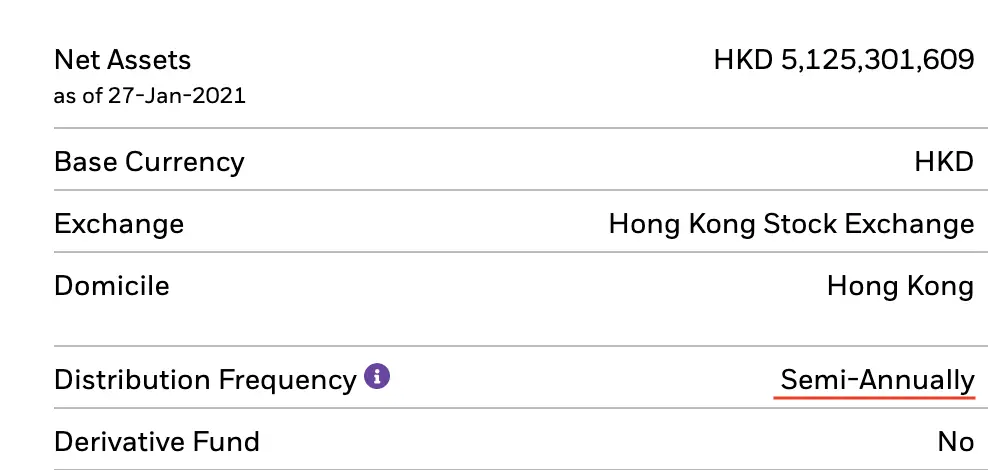
Meanwhile, ChinaAMC intends to distribute your dividends annually in December.
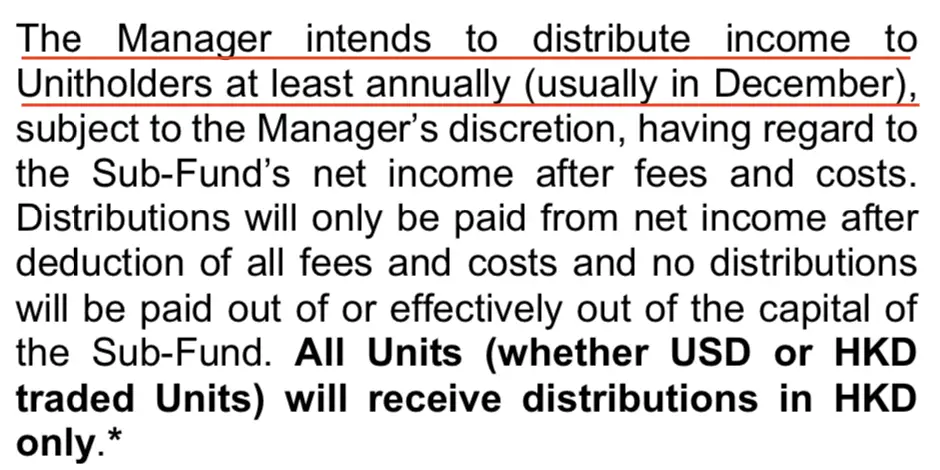
However, these distributions are not guaranteed!
This is because most of the stocks in the index are tech stocks. They are aggressive growth stocks that would reinvest most of the profits into their company.
That way, these companies will continue to experience high amounts of growth!
Since the stocks themselves are not distributing dividends, the ETFs can’t distribute dividends to you either.
As such, you should not expect to receive any dividends when investing in this ETF!
Expense ratio
On top of the trading commissions you’ll need to pay the broker, you will have to pay an expense ratio to the fund manager as well.
The expense ratio is charged by the fund manager to cover the costs of running the fund.
Based on the value of your assets in the fund, you will be charged an annual fee.
Here are the expense ratios for these 2 funds:
| 3067 | 3088 | |
|---|---|---|
| Expense Ratio | 0.25% | 0.4% |
When you compare the 2 expense ratios, 3067 has a lower cost!
However, both of their expense ratios are higher than most S&P 500 ETFs which usually cost less than 0.1%.
This could probably be due to BlackRock being a much more well established fund manager. They have around $8.7 trillion worth of assets under management!
In contrast, ChinaAMC only has around$245.5 billion worth of assets.
As such, BlackRock has a larger economies of scale, possibly resulting in the lower expense ratio charged.
Average trading volume
If you are looking to actively trade using these ETFs, you may want to look at their liquidity. One of the indicators you may want to look at is the ETF’s trading volume.
Since both funds are rather new, Yahoo Finance does not have enough data to calculate the average trading volume.
| 3067 | 3088 | |
|---|---|---|
| Trading Volume | 9 million | 3.8 million |
Both ETFs have a relatively high trading volume. As such, you will be able to buy or sell your units at your intended price.
Verdict
Here is a breakdown between 3067 and 3088:
| 3067 | 3088 | |
|---|---|---|
| Index Tracked | Hang Seng Tech Index | Hang Seng Tech Index |
| Fund Manager | BlackRock | ChinaAMC |
| Exchange | HKEX | HKEX |
| Currency | HKD | HKD |
| Estimated Unit Price | HKD20 | HKD12 |
| Minimum Units to Invest | 100 | 200 |
| Dividend Distribution | Semi-Annually | Annually |
| Expense Ratio | 0.25% | 0.4% |
| Trading Volume | 9 million | 5.8 million |
So which ETF should you choose? The choice is rather clear since 3067 has a lower expense ratio.
When you are investing in 2 ETFs that track the same index, the performances will be very similar.
The performance may only differ slightly due to the tracking error of the fund.
To calculate your net returns, you’ll need to subtract off any of the costs incurred. The extra 0.15% that you’re paying for 3088 may come to hurt you, especially in the long run!
Conclusion
Both 3067 and 3088 should have very similar performances since they track the same index. However, the huge difference in expense ratios may ultimately affect your net returns!
As such, 3067 should be the more preferable ETF to invest in.
Both of these ETFs track the Hang Seng Tech Index, and not the Hang Seng Index. You can check out my guide on buying the Hang Seng Index from Singapore for more information.
If you’re looking for a way to track the markets and your portfolio, you can consider using TradingView, which allows you to monitor more than 50 stock exchanges.

Do you like the content on this blog?
To receive the latest updates from my blog and personal finance in general, you can follow me on my Telegram channels (Personal Finance or Crypto) and Facebook.
Are you passionate about personal finance and want to earn some flexible income?

